|
Overview
This page shows the differences between daily sea surface temperature (SST) analyses produced around the world.
It is a contribution to the Group for High Resolution SST (GHRSST) (external link).
SST Ensemble Intercomparison Statistics
The median and standard deviation of daily SST analyses are displayed below. The analyses used in the statistics are listed in the table below:
| Analysis name |
Analysis information |
Link |
| OSTIA |
Operational Sea Surface Temperature and Sea Ice Analysis (OSTIA) produced by the UK Met Office |
OSTIA information |
| NAVO K10 |
Global 10km SST model from Naval Oceanographic Office (NAVO) |
NAVO K10 information |
| MGDSST |
Merged Satellite and In-situ Data Global Daily Sea Surface Temperature (MGDSST) from Japan Meteorological Agency (JMA) |
MGDSST information |
| RSS MW Fusion |
Remote Sensing Systems (USA) analysis using microwave (MW) data |
RSS information |
| RSS MW+IR Fusion |
Remote Sensing Systems (USA) analysis using microwave (MW) and infra-red (IR) data |
RSS information |
| FNMOC |
Analysis generated by the Fleet Numerical Meteorology and Oceanography Centre (US) |
FNMOC information |
| GAMSSA |
Global Australian Multi-Sensor SST Analysis (GAMSSA) produced by the Australian Bureau of Meteorology (ABOM) |
GAMSSA information |
| DMI |
Analysis produced by the Danish Meteorological Institute |
DMI information |
| MUR |
Multiscale Ultrahigh Resolution (MUR) analysis produced by the Jet Propulsion Laboratory (JPL) |
MUR information |
| OSPO Night |
Analysis produced by the Office of Satellite and Product Operations (OSPO) |
OSPO Night information |
| CMC0.1 |
Canadian Meteorological Centre analysis with 0.1 degree resolution |
CMC0.1 information |
| ODYSSEA |
Ifremer analysis with 0.1 degree resolution |
ODYSSEA information |
The analysis grids have been homogenised by area averaging onto a 0.25° lat/lon grid prior to comparison. The data have been restricted to the OSTIA ocean mask. The sea ice data shown is derived from OSTIA. Where the OSTIA analysis indicates ice, SST values are masked out.
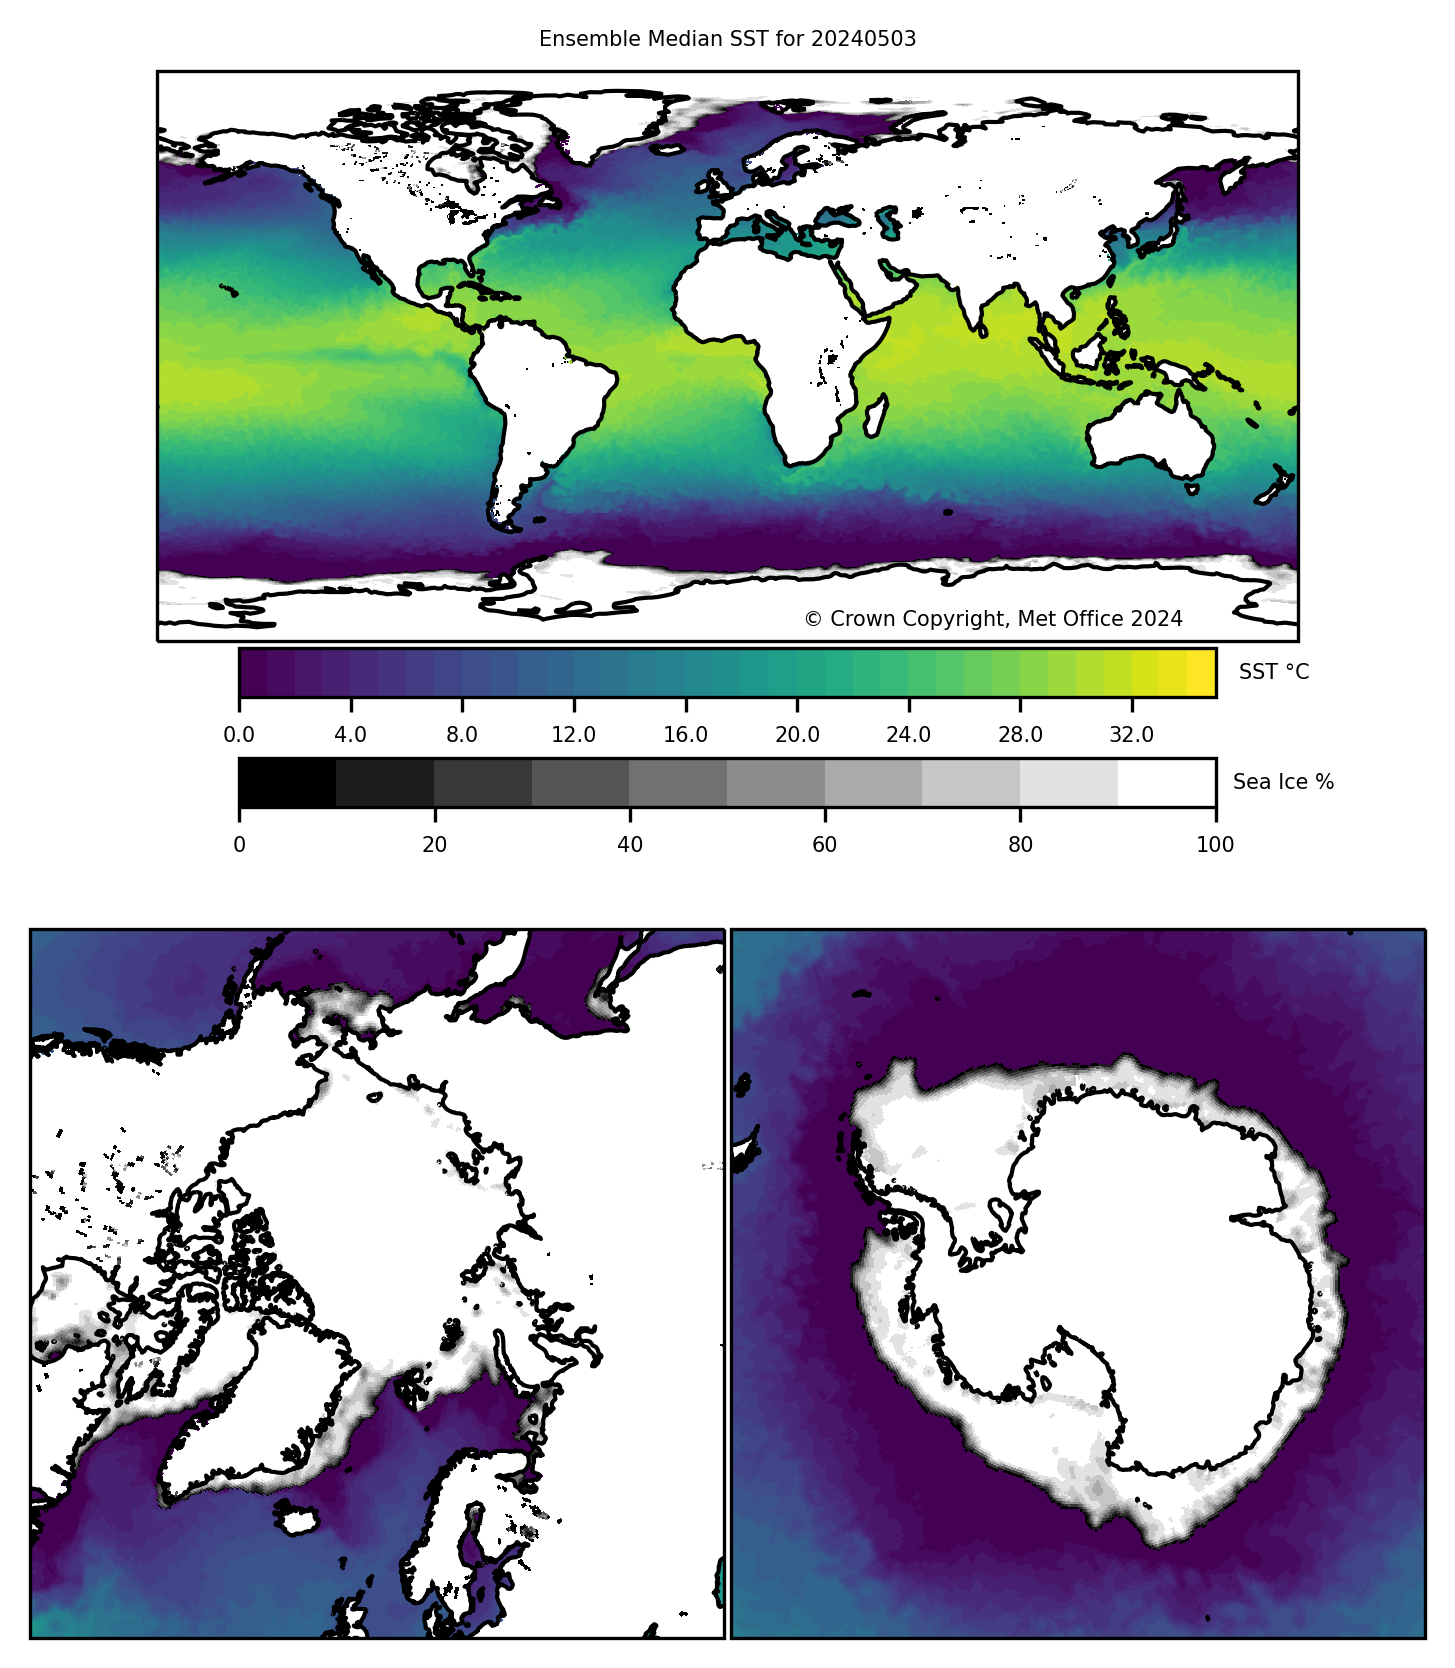
Median SST analyses. Animation of last 7 days.

Standard deviation of SST analyses. Animation of last 7 days.

Horizontal Gradients of GMPE median. Animation of last 7 days.
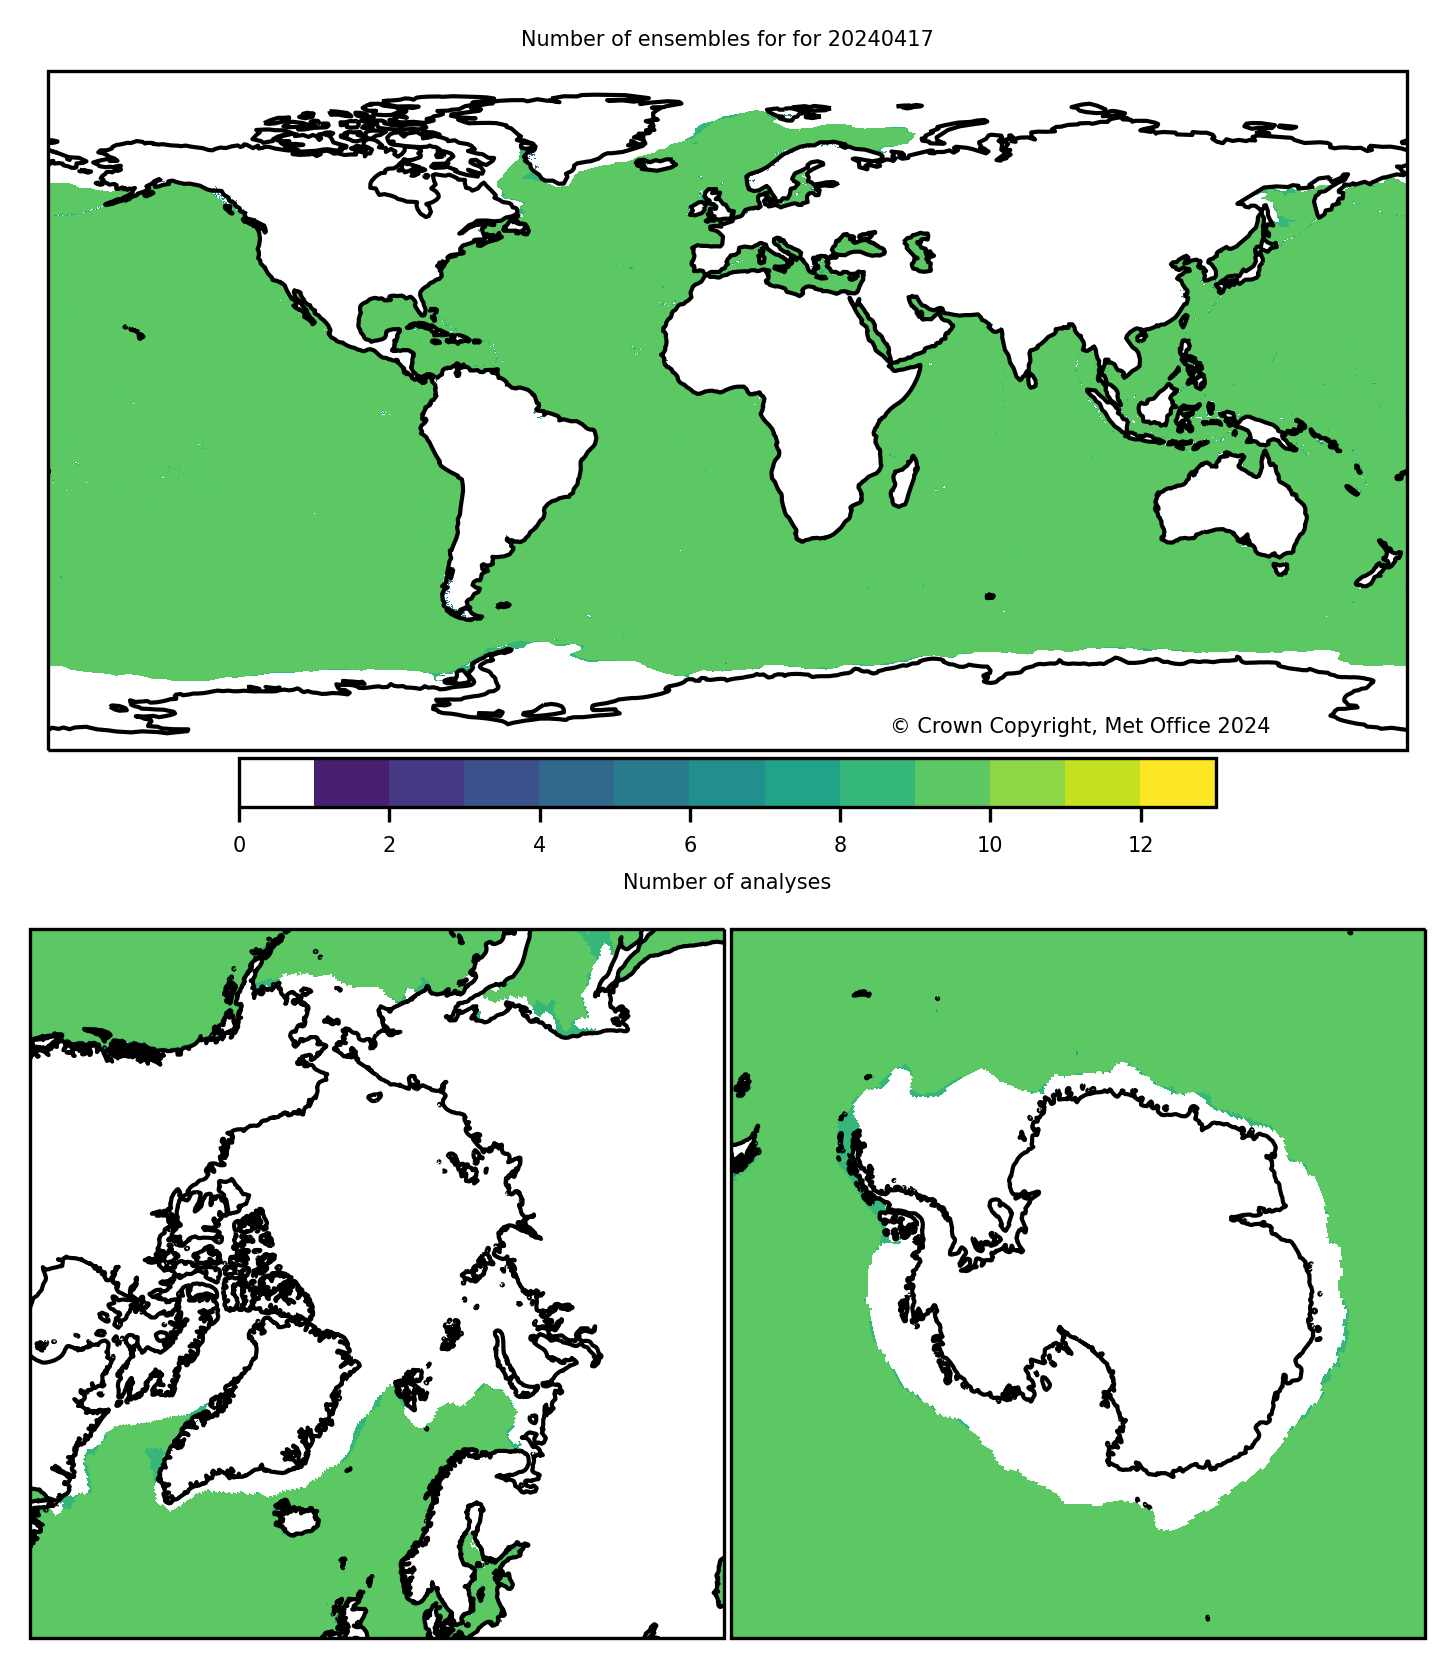
Number of Analyses available at each grid point. Animation of last 7 days.
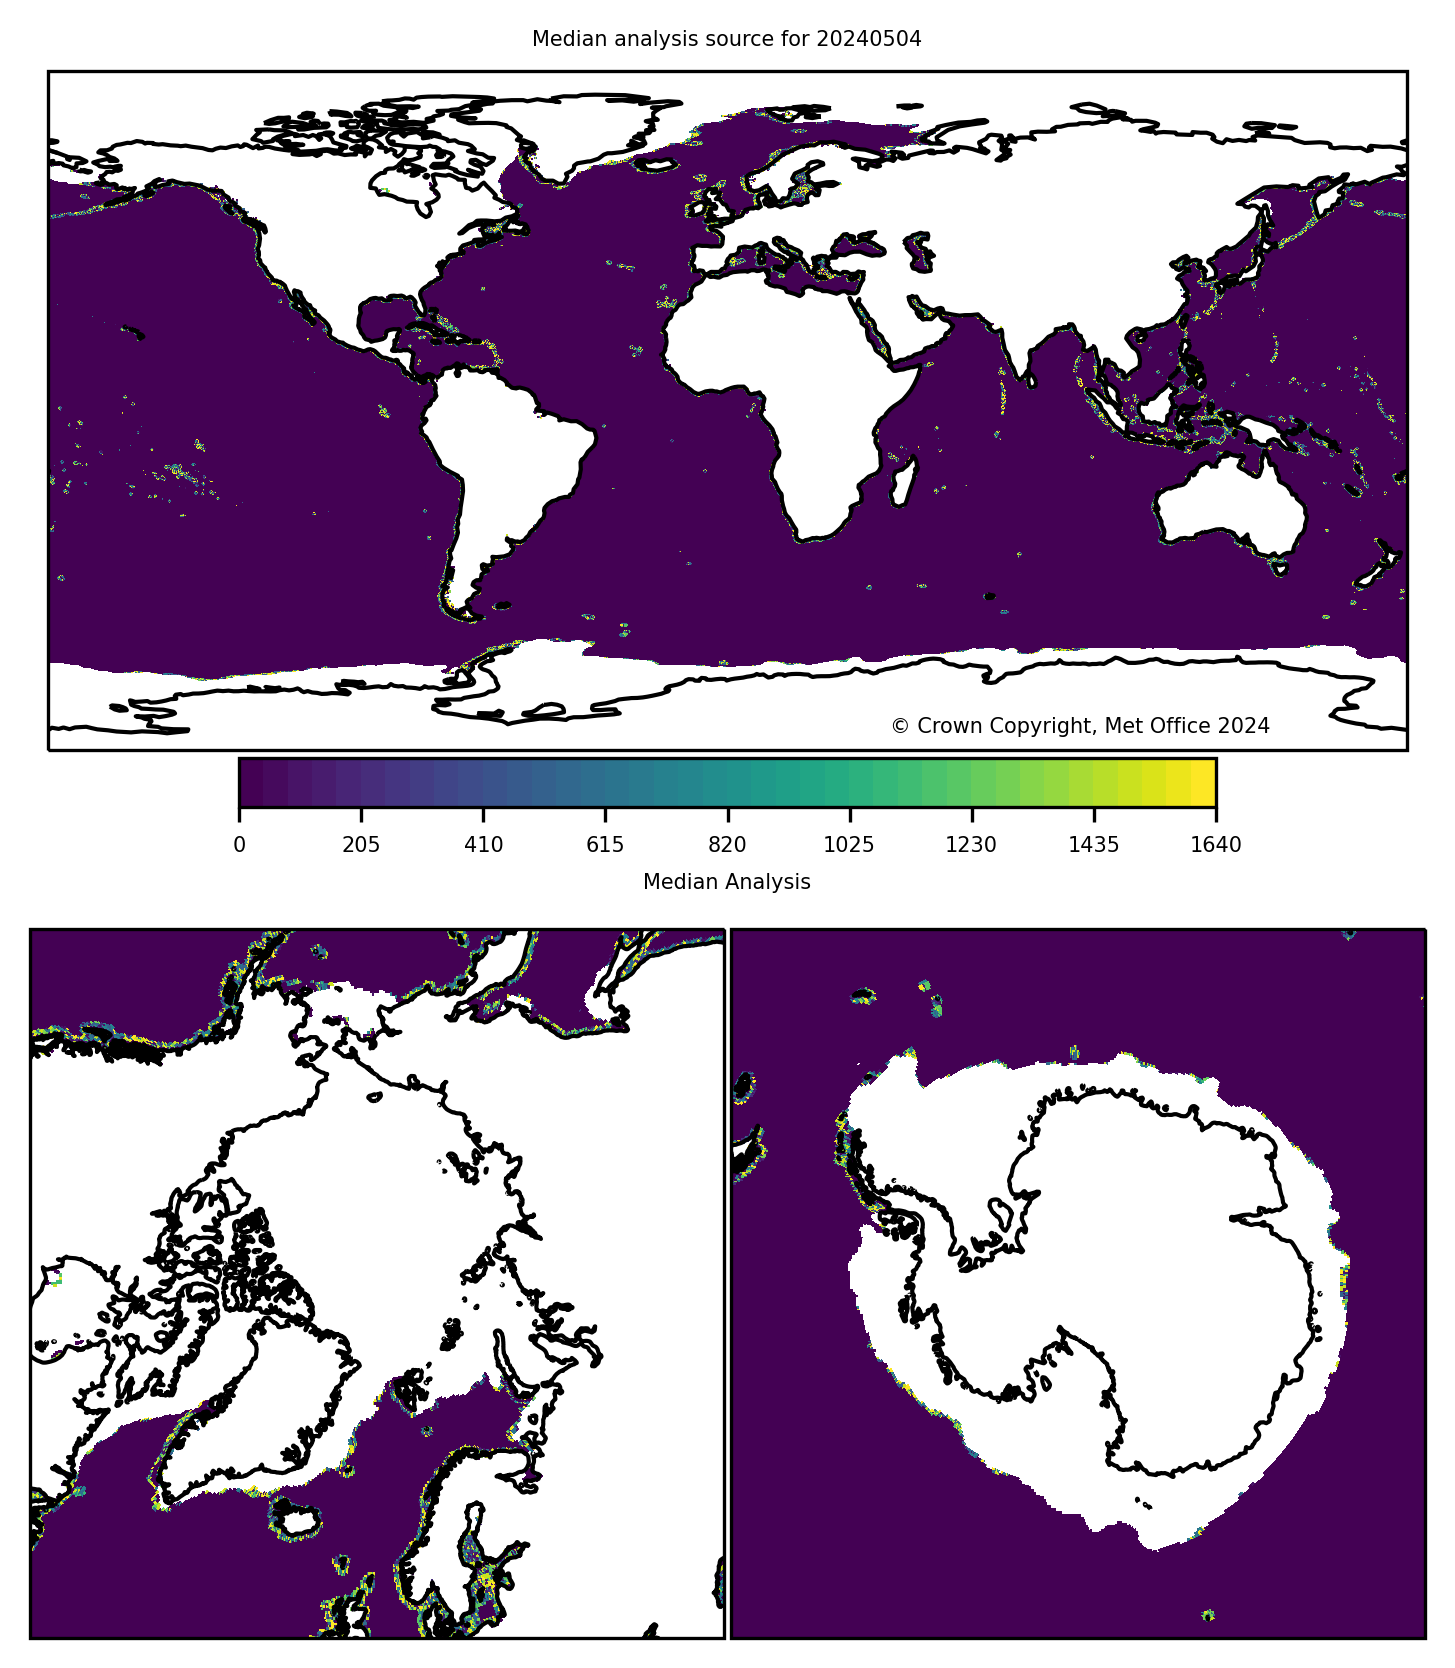
Analysis Source of the Median SST. Animation of last 7 days.
Analysis Intercomparison
This section shows the differences between several SST analysis products and the ensemble median. The horizontal gradient of each contributing SST analysis are also shown.
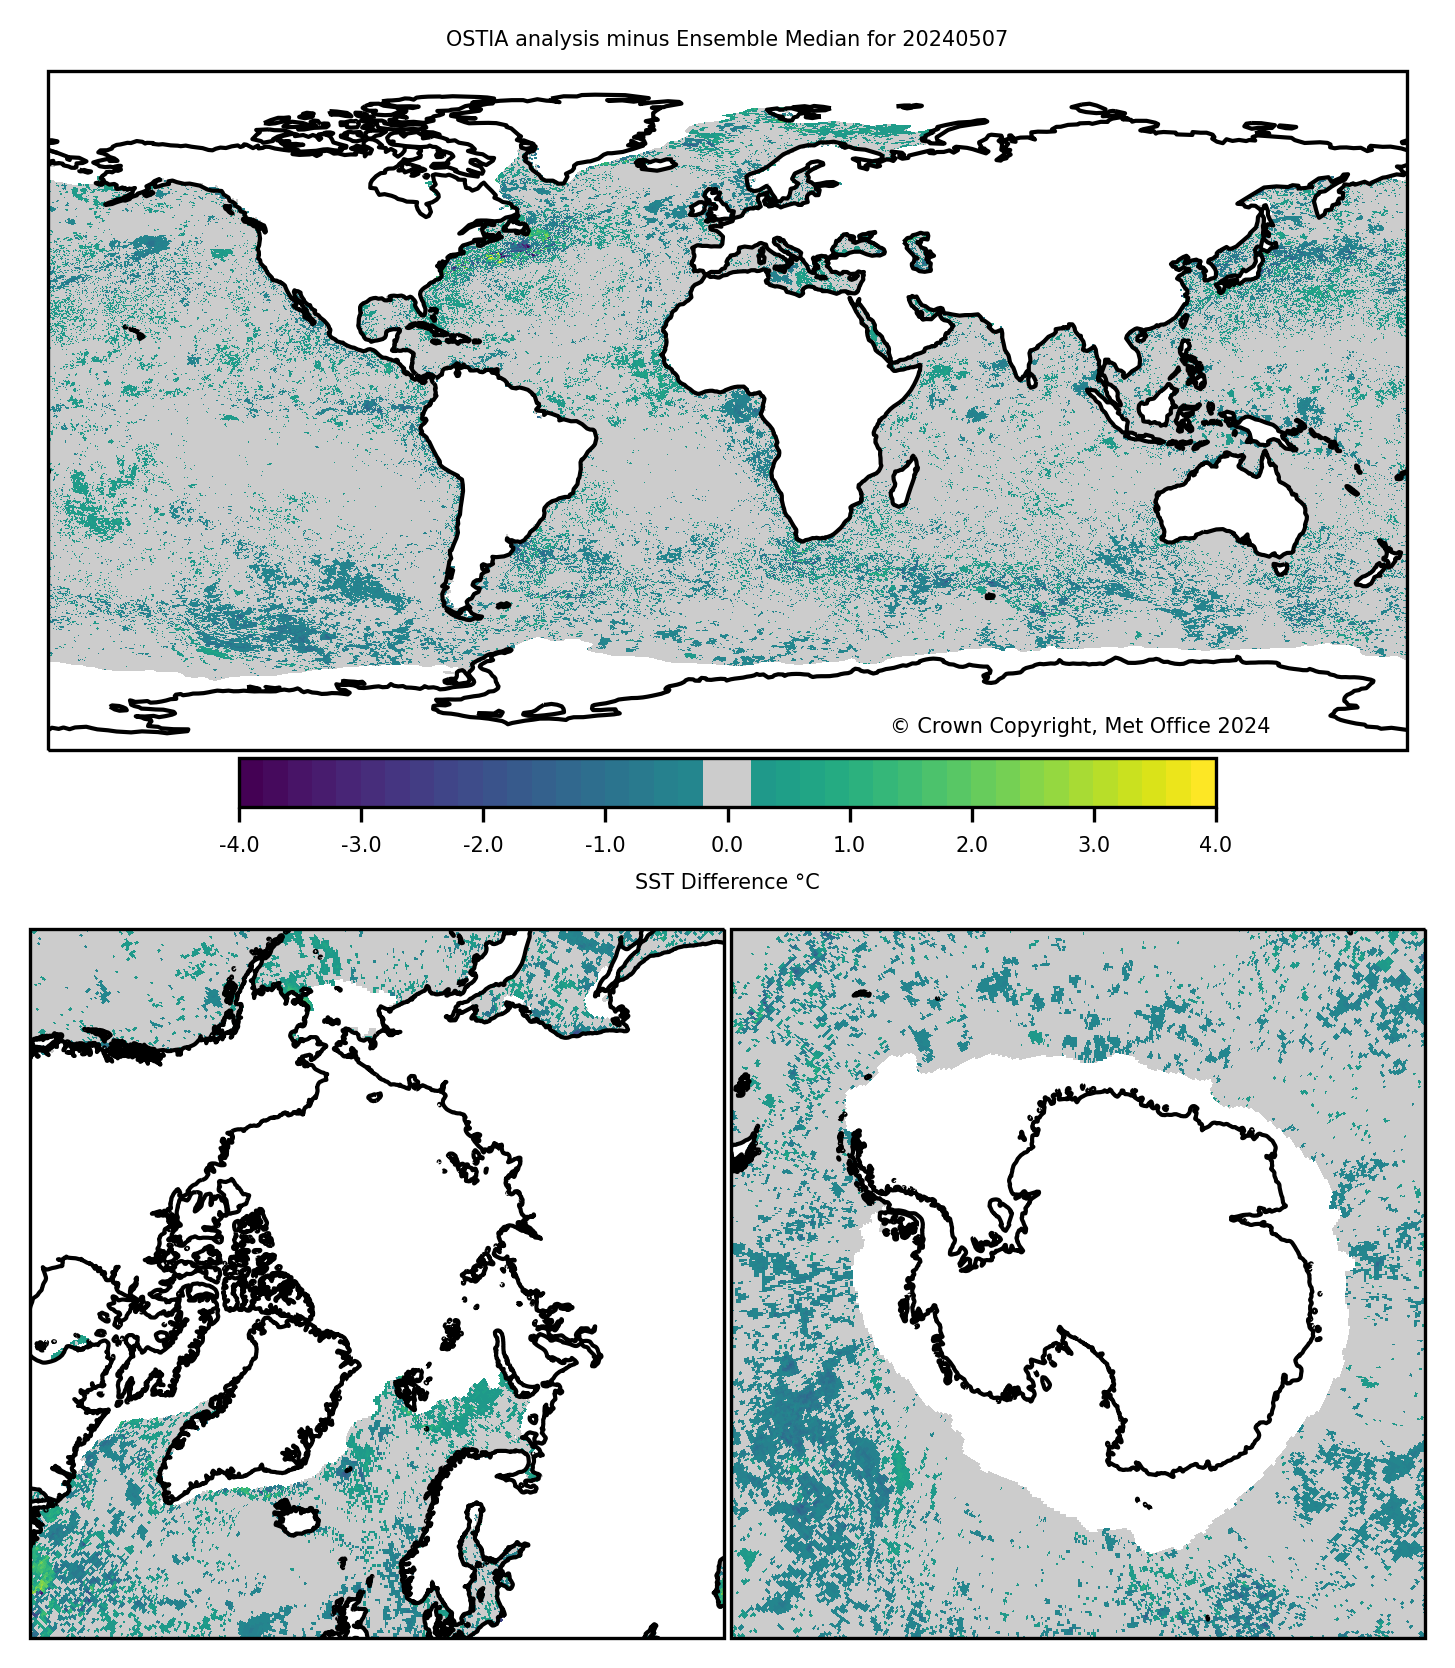
OSTIA minus ensemble median SST analysis. Animation of last 7 days.

OSTIA SST analysis horizontal gradients. Animation of last 7 days.
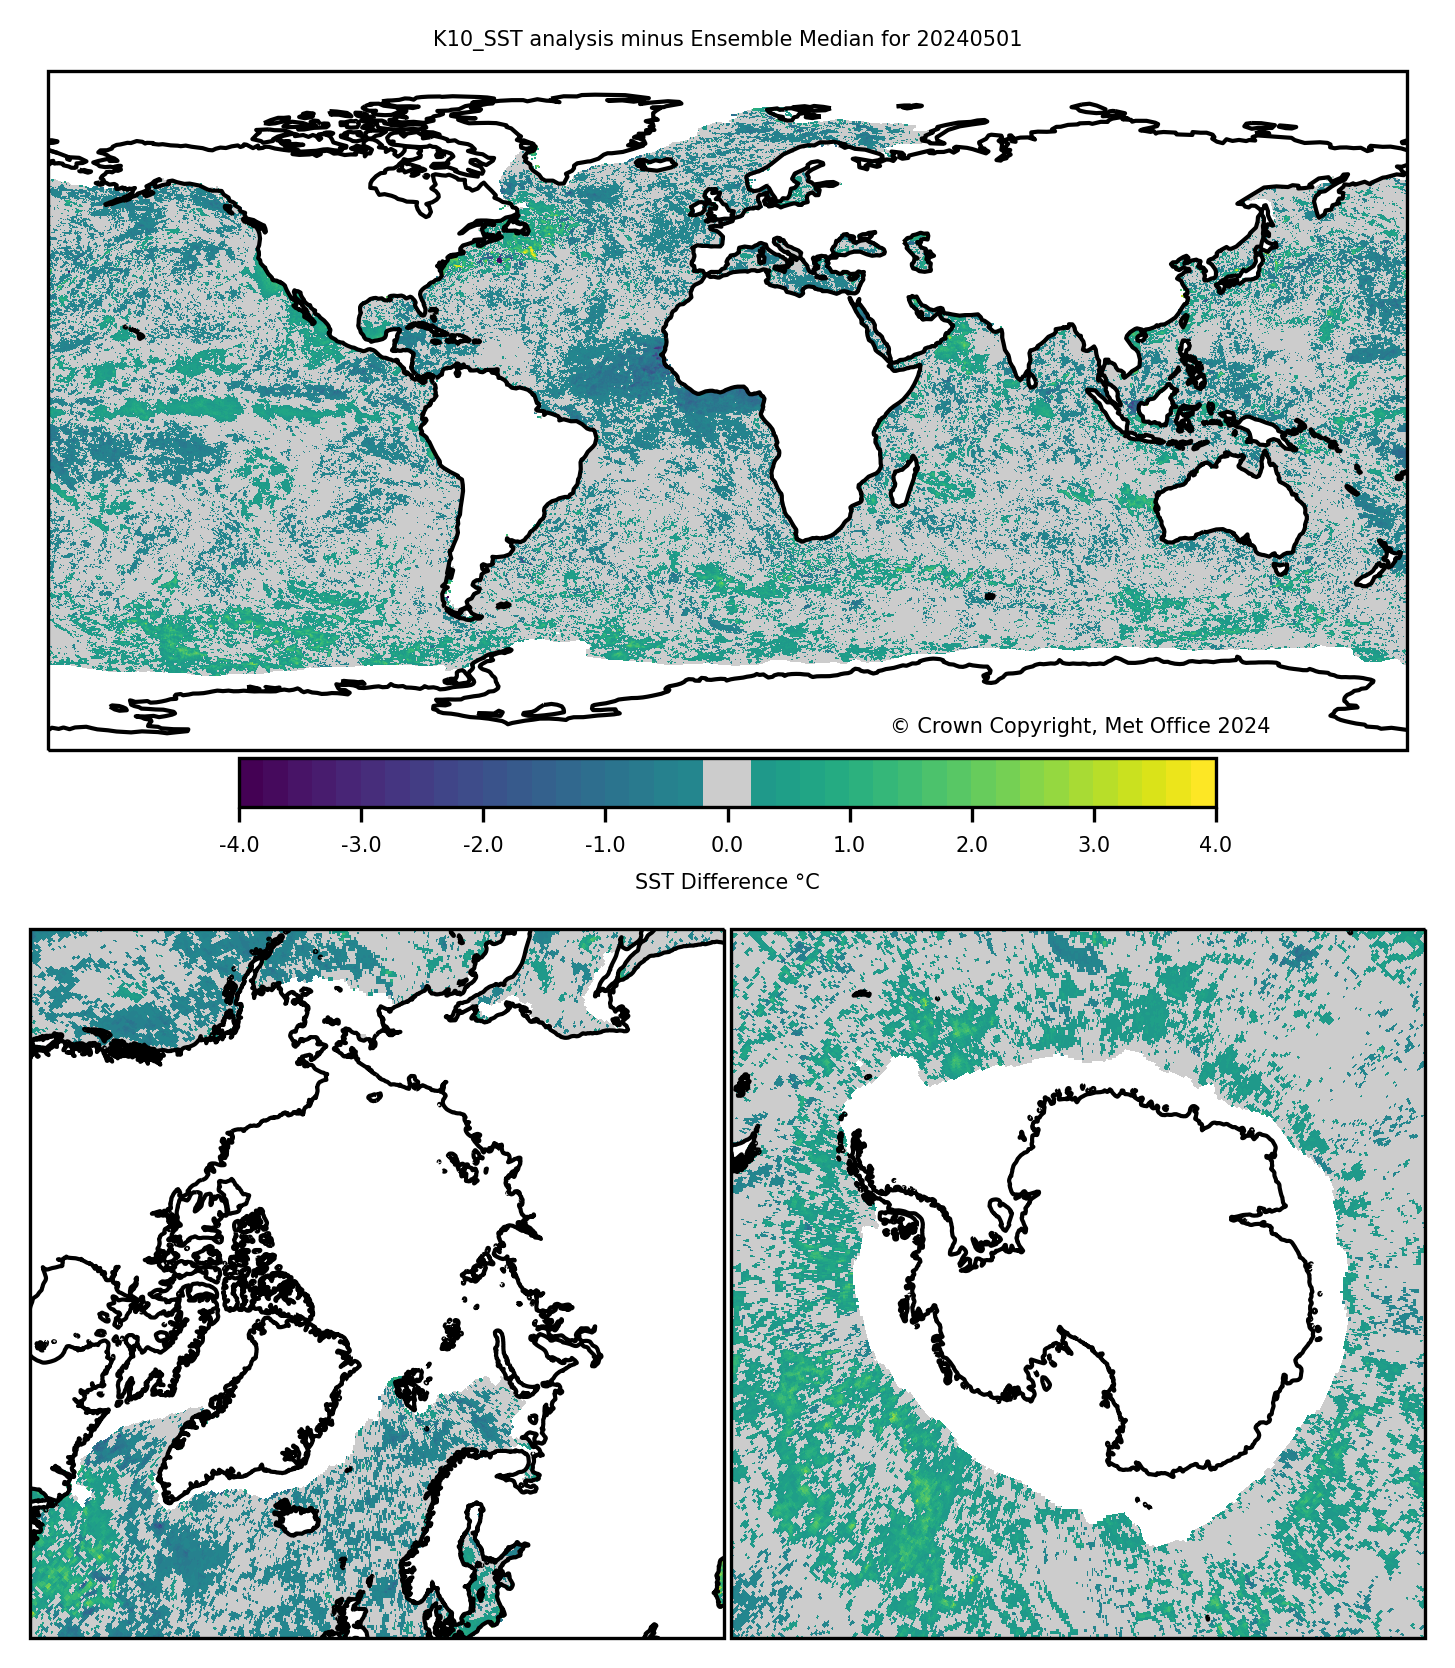
NAVO K10 minus ensemble median SST analysis. Animation of last 7 days.
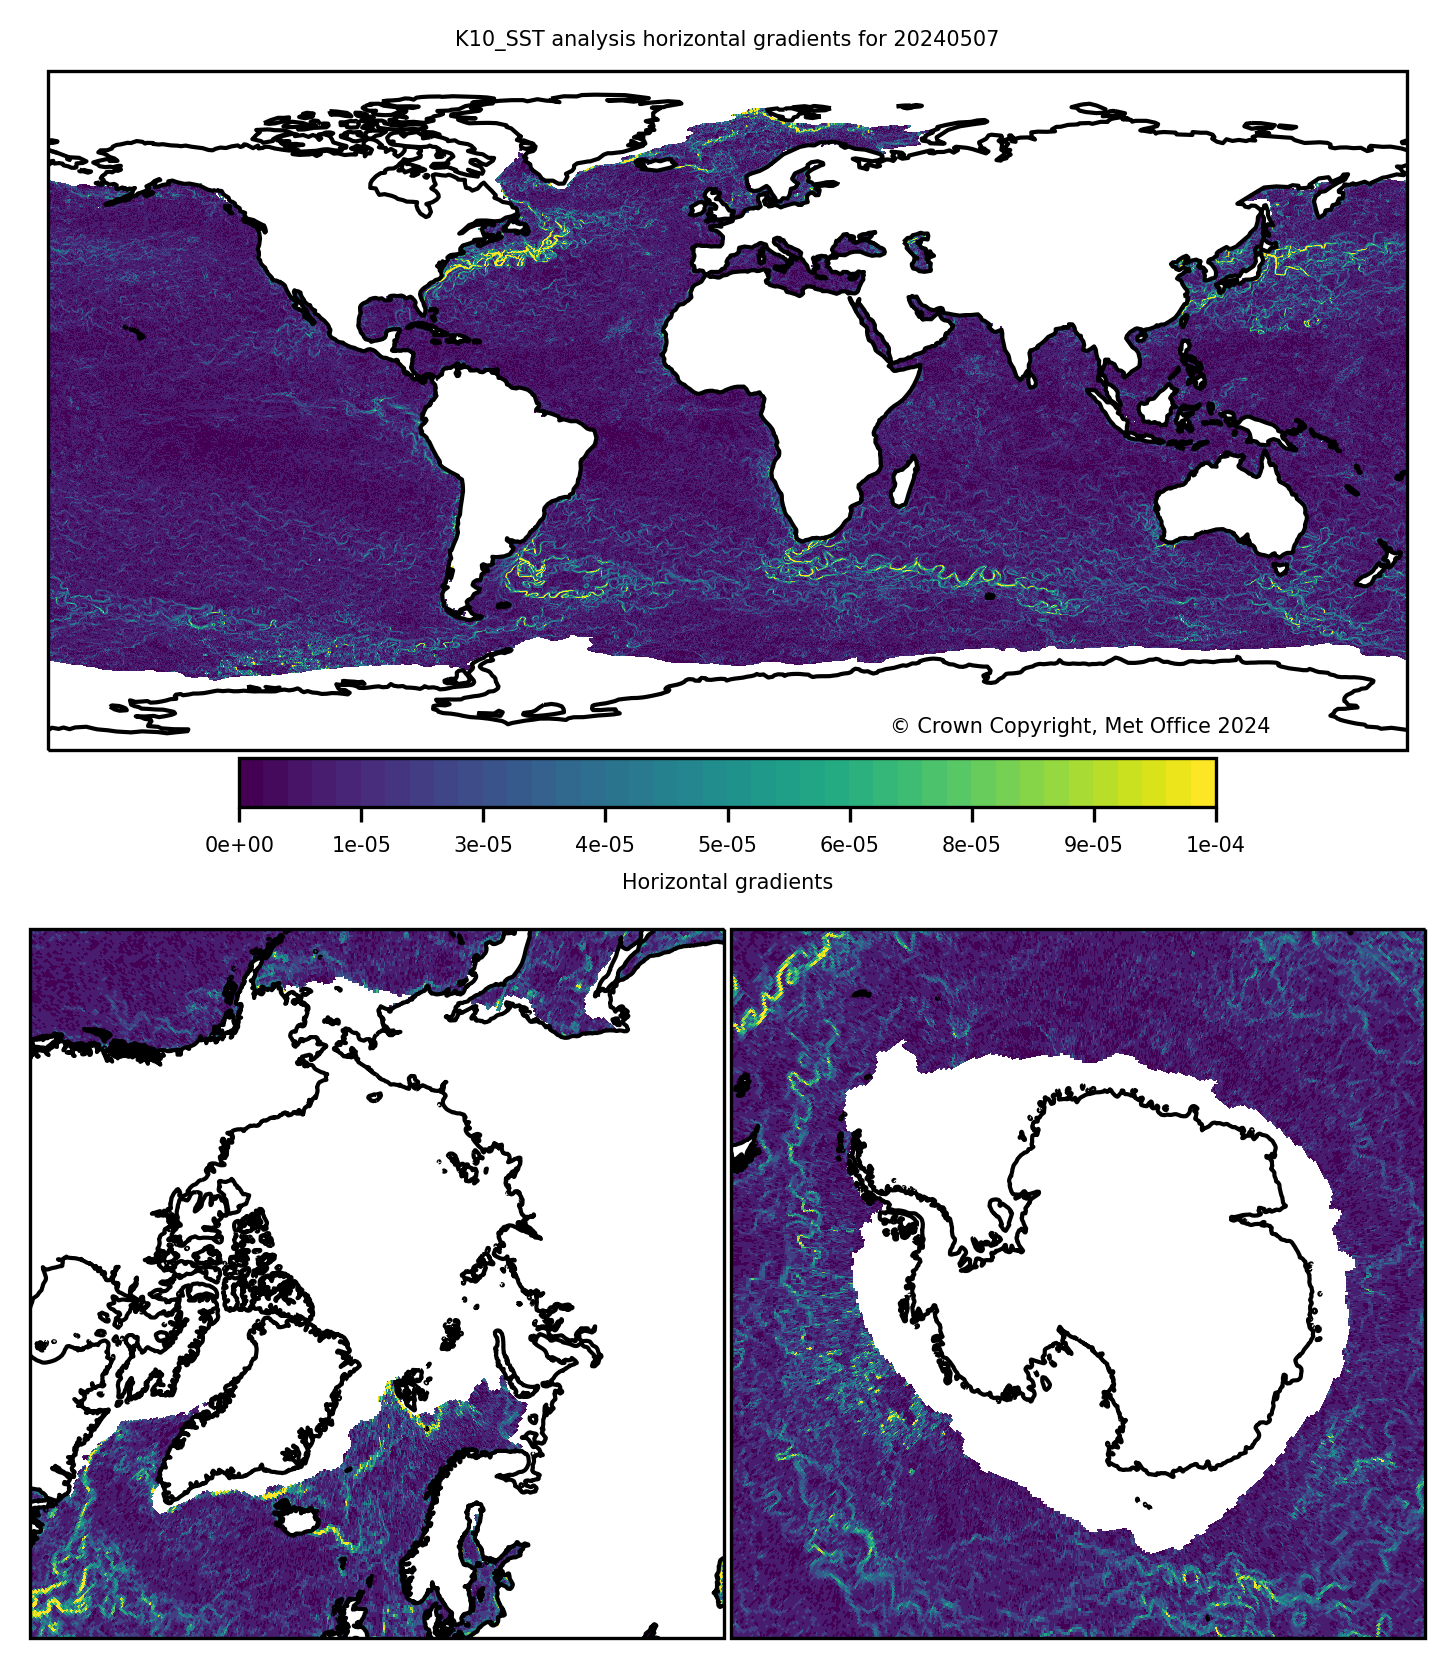
NAVO K10 SST analysis horizontal gradients. Animation of last 7 days.
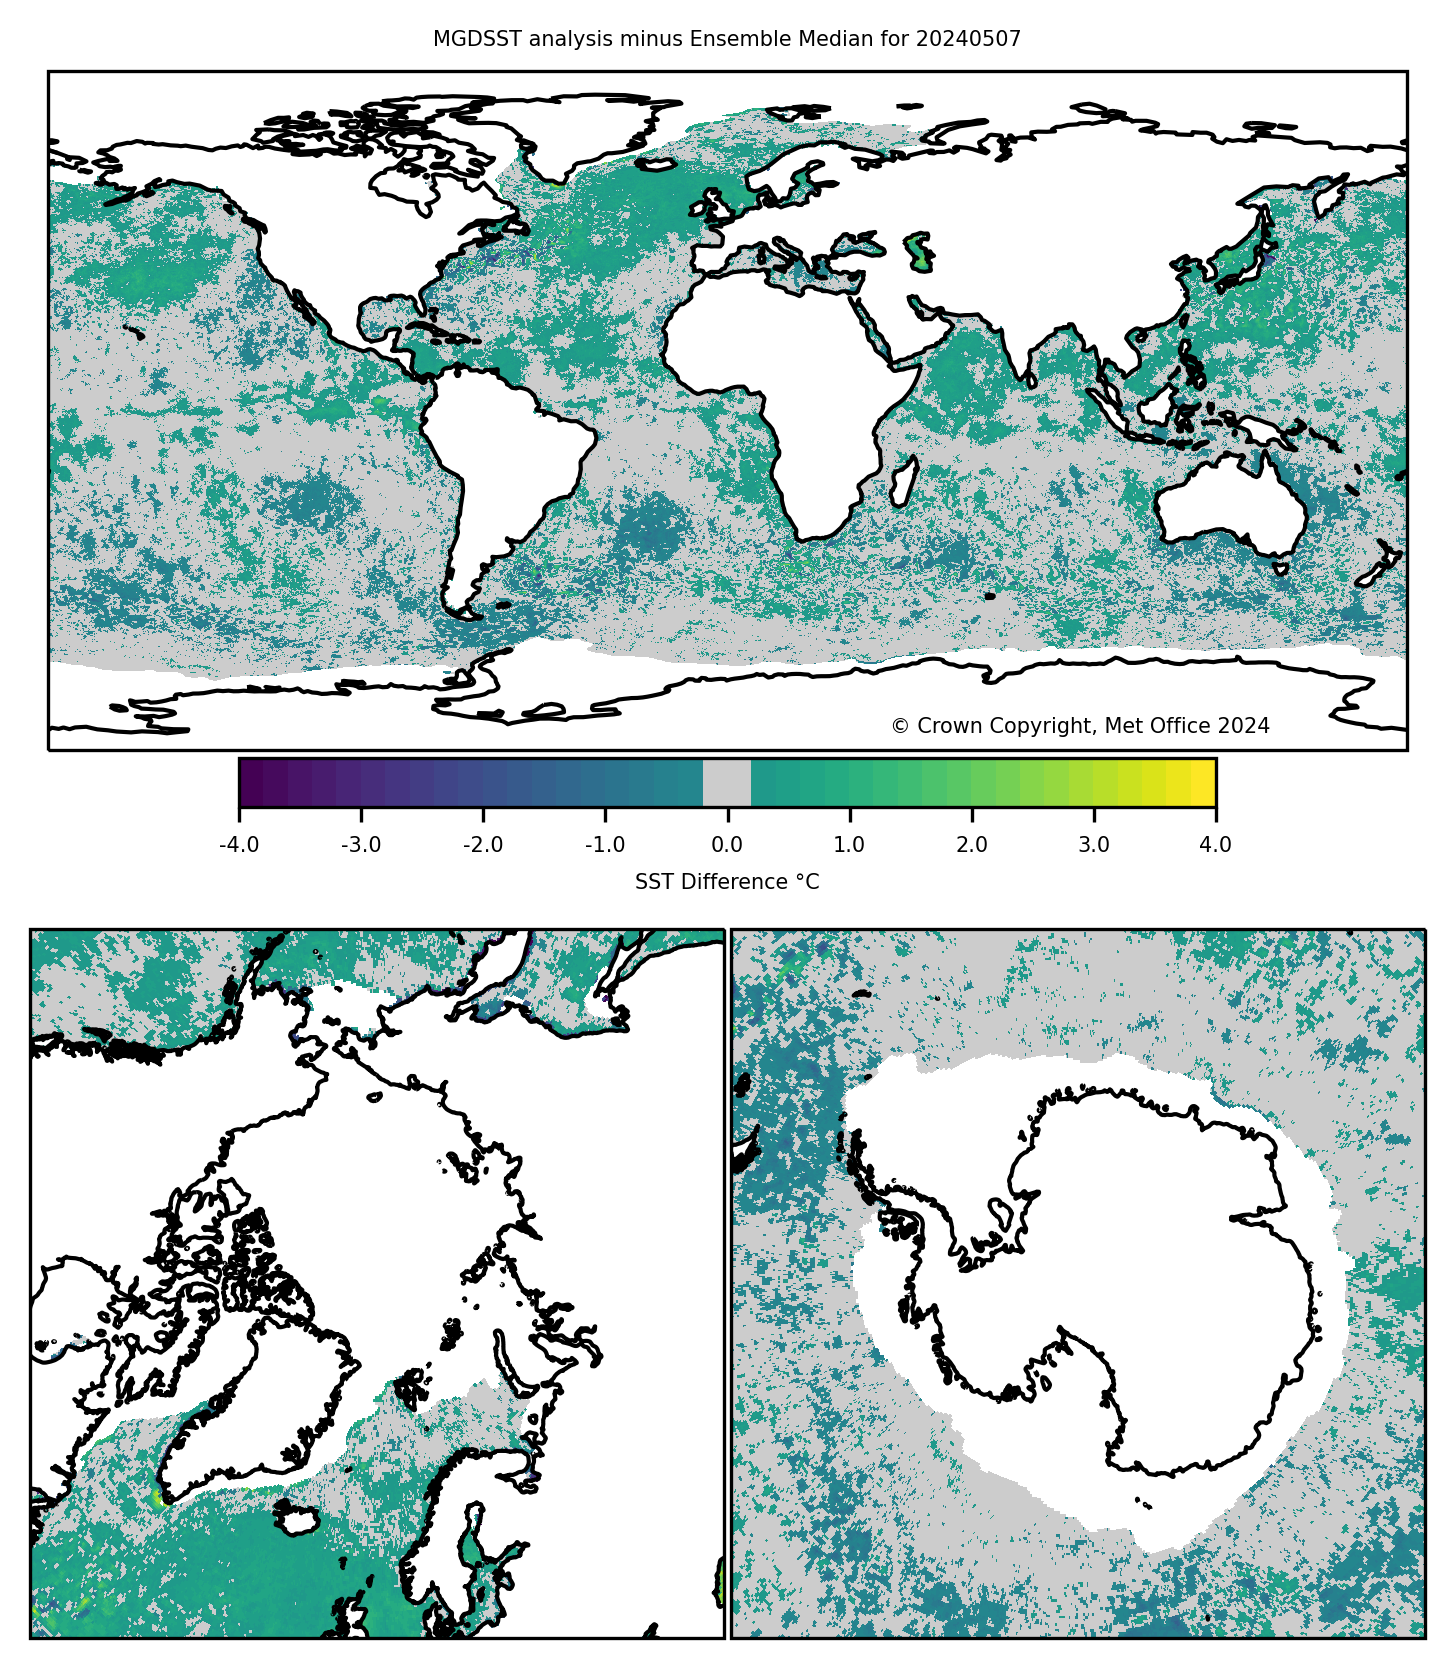
MGDSST minus ensemble median SST analysis. Animation of last 7 days.
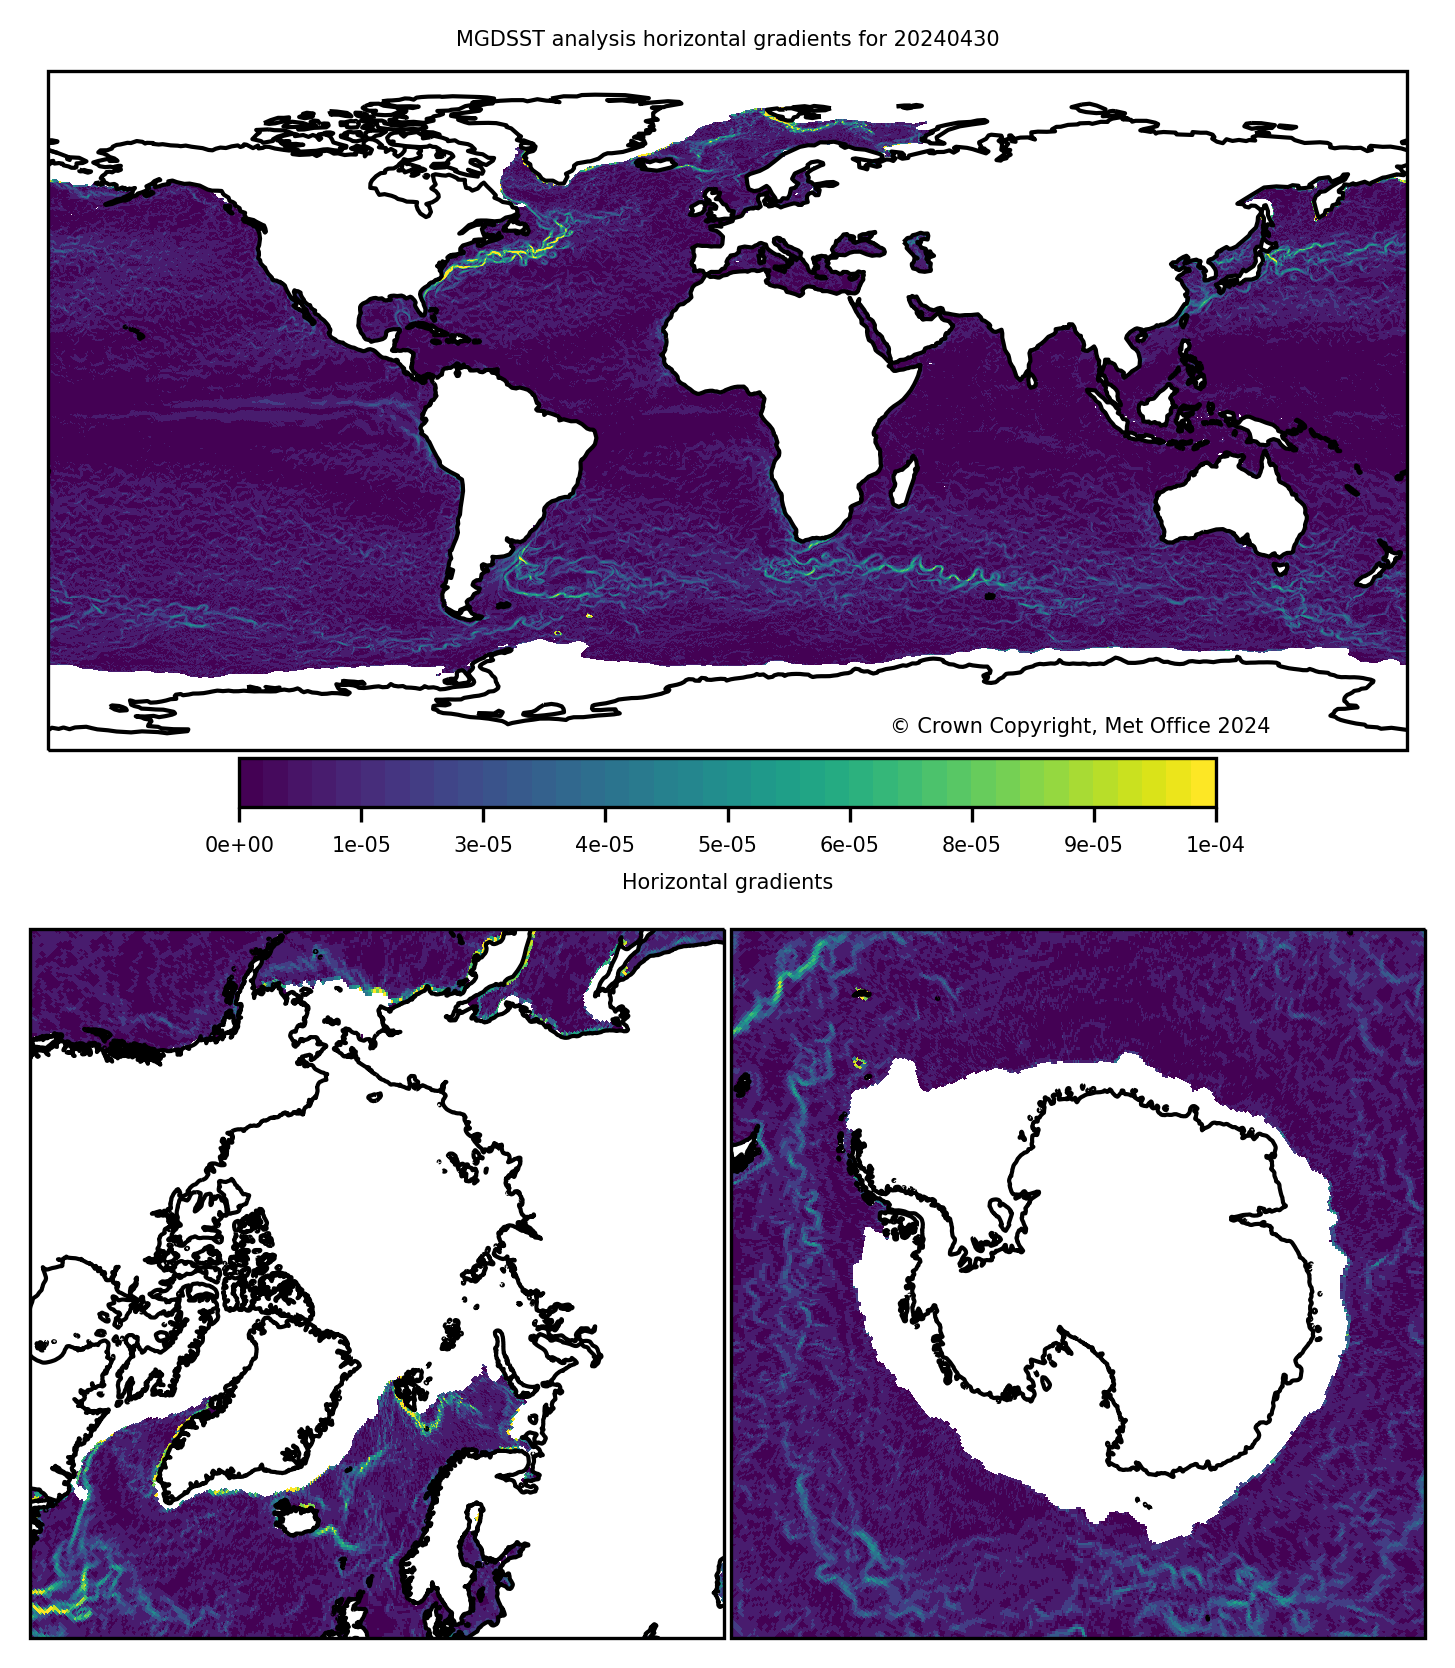
MGDSST SST analysis horizontal gradients. Animation of last 7 days.
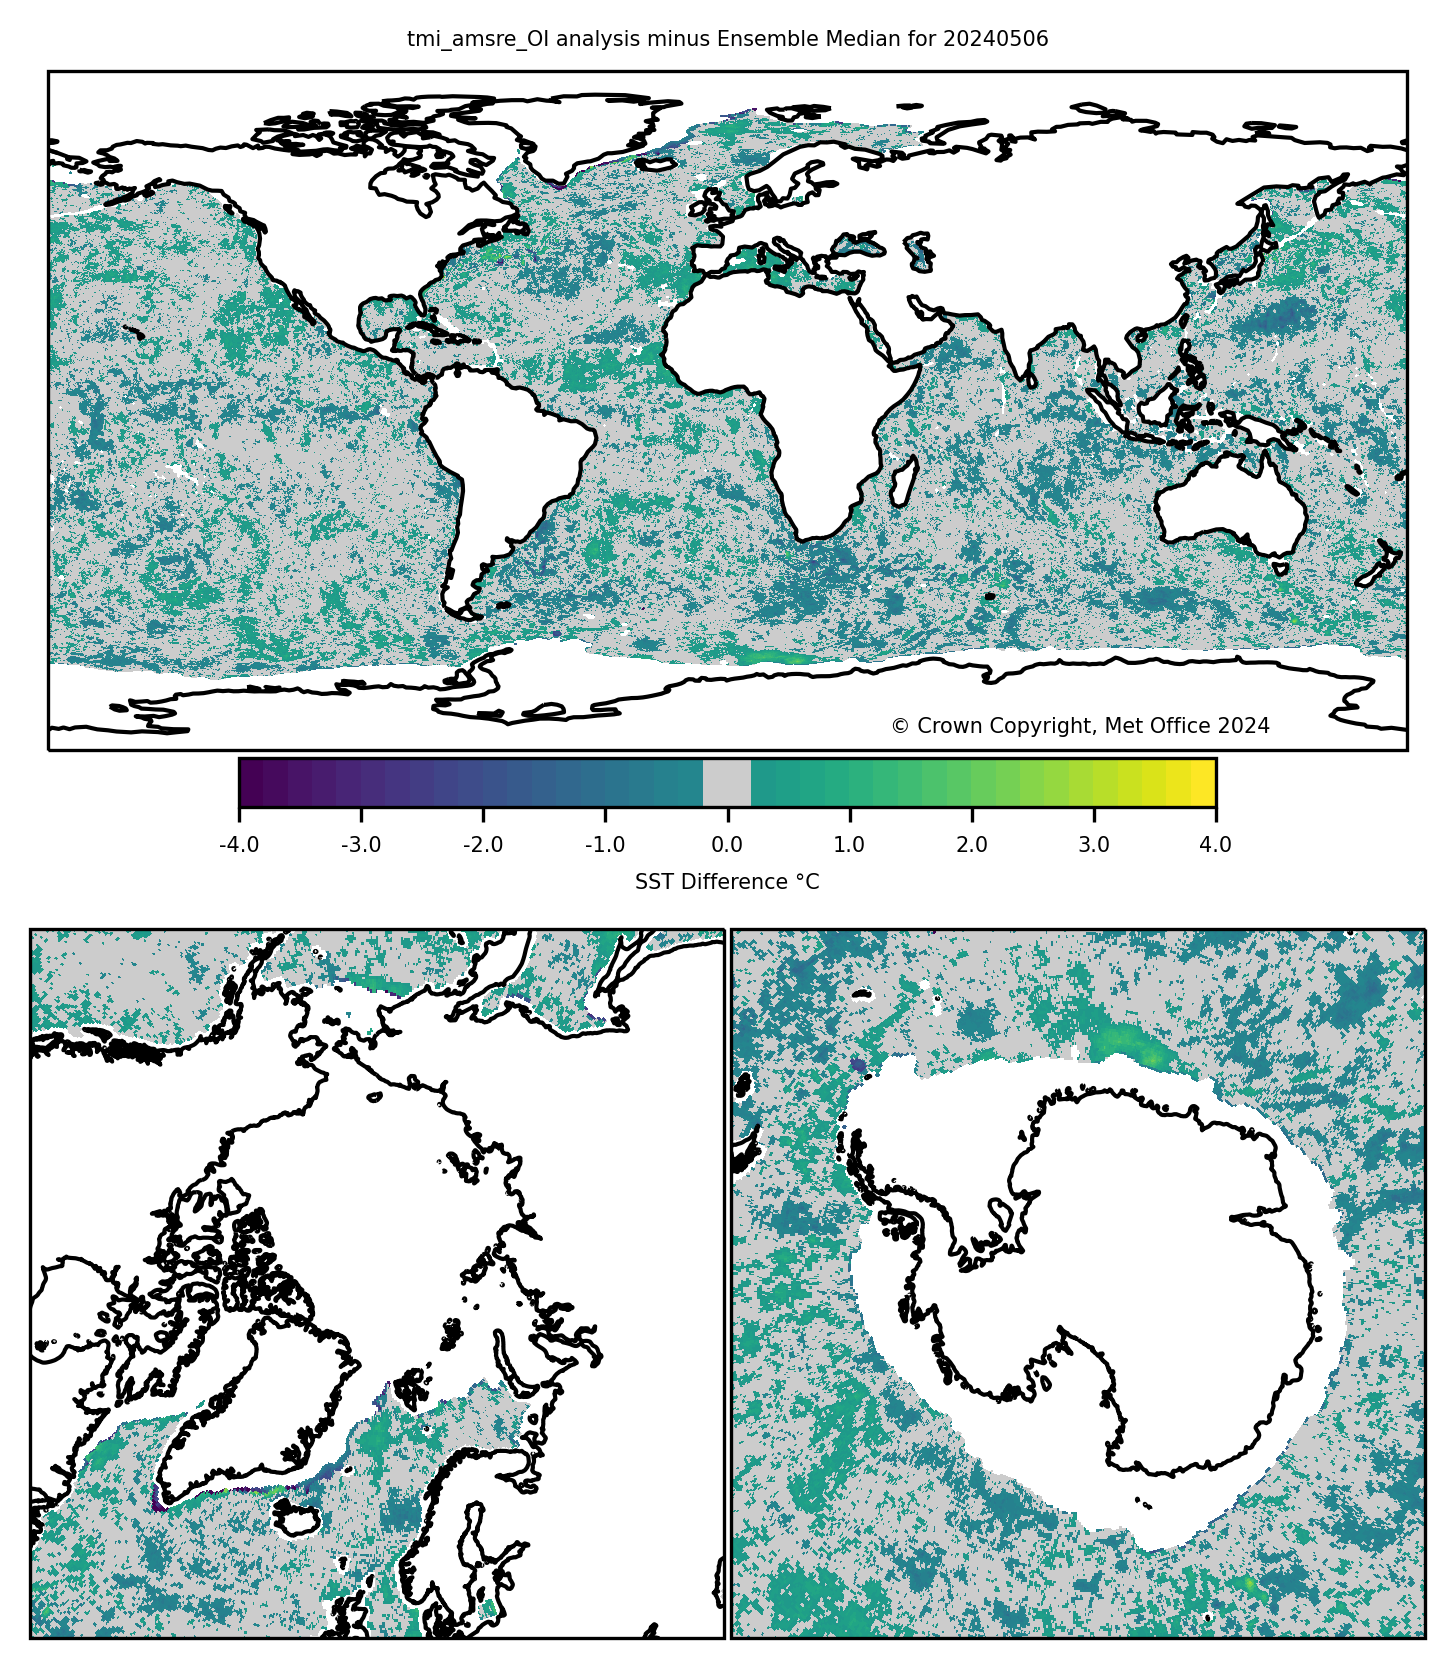
RSS MW Fusion minus ensemble median SST analysis. Animation of last 7 days.
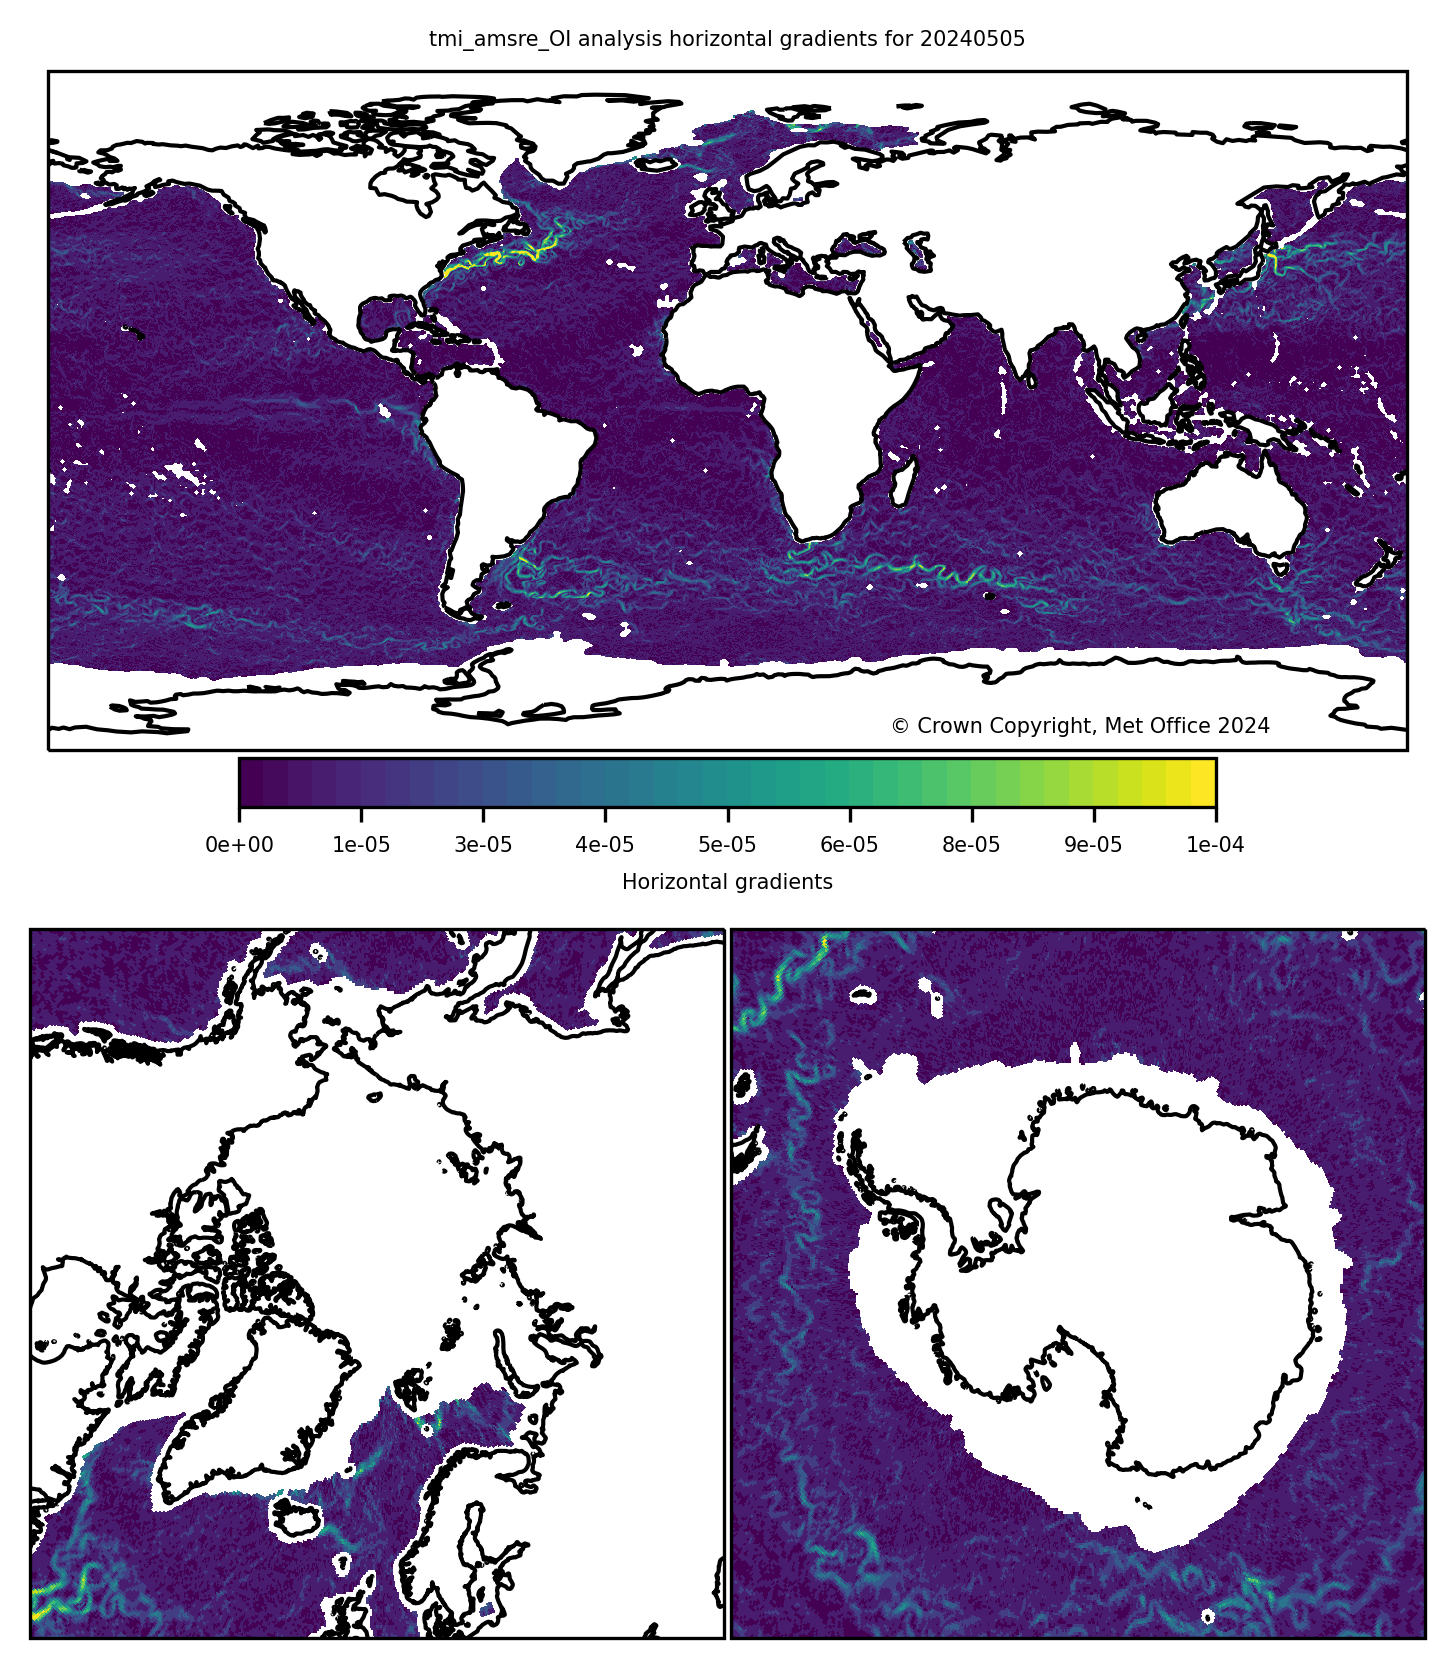
RSS MW Fusion SST analysis horizontal gradients. Animation of last 7 days.
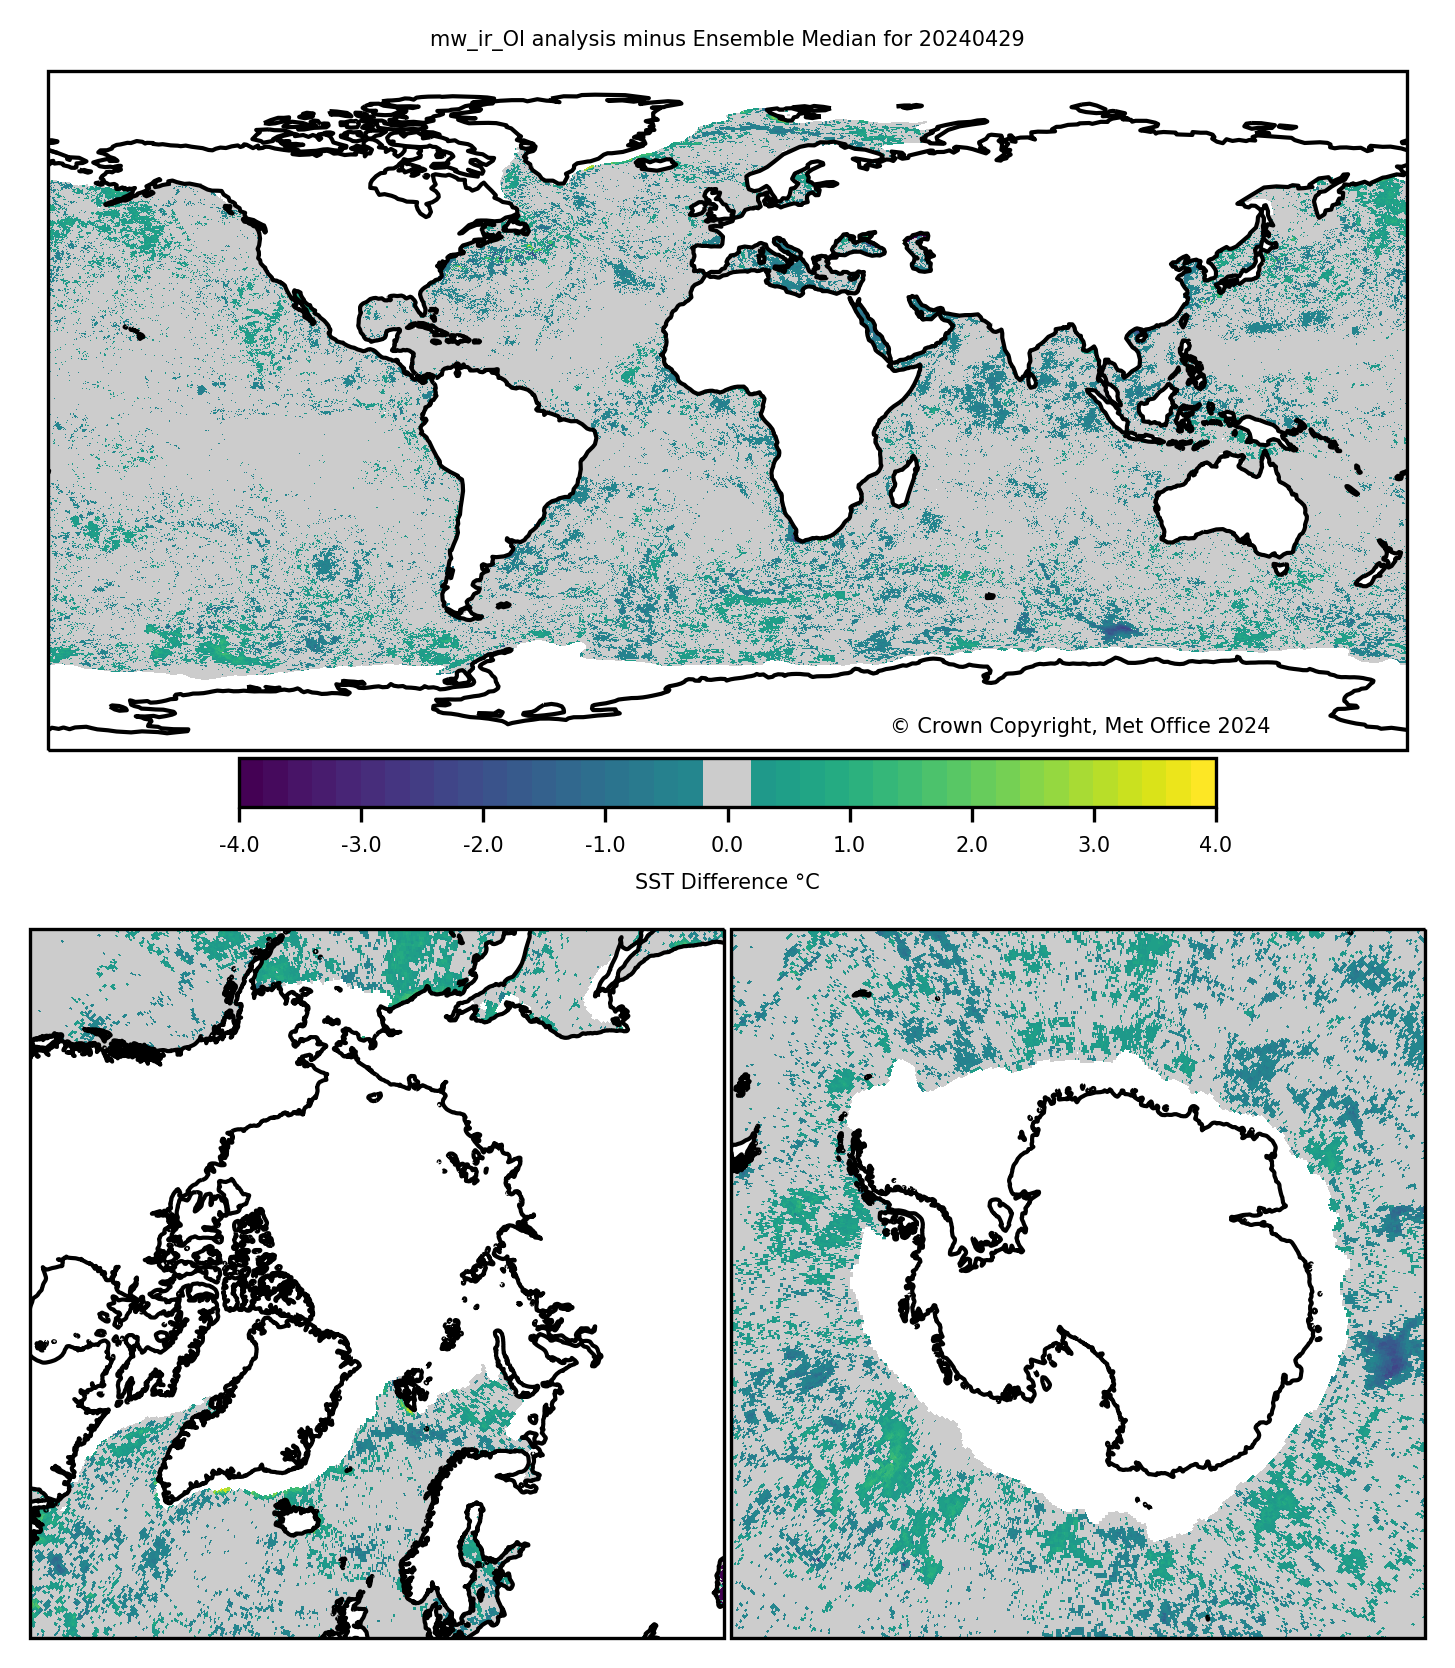
RSS MW+IR Fusion minus ensemble median SST analysis. Animation of last 7 days.
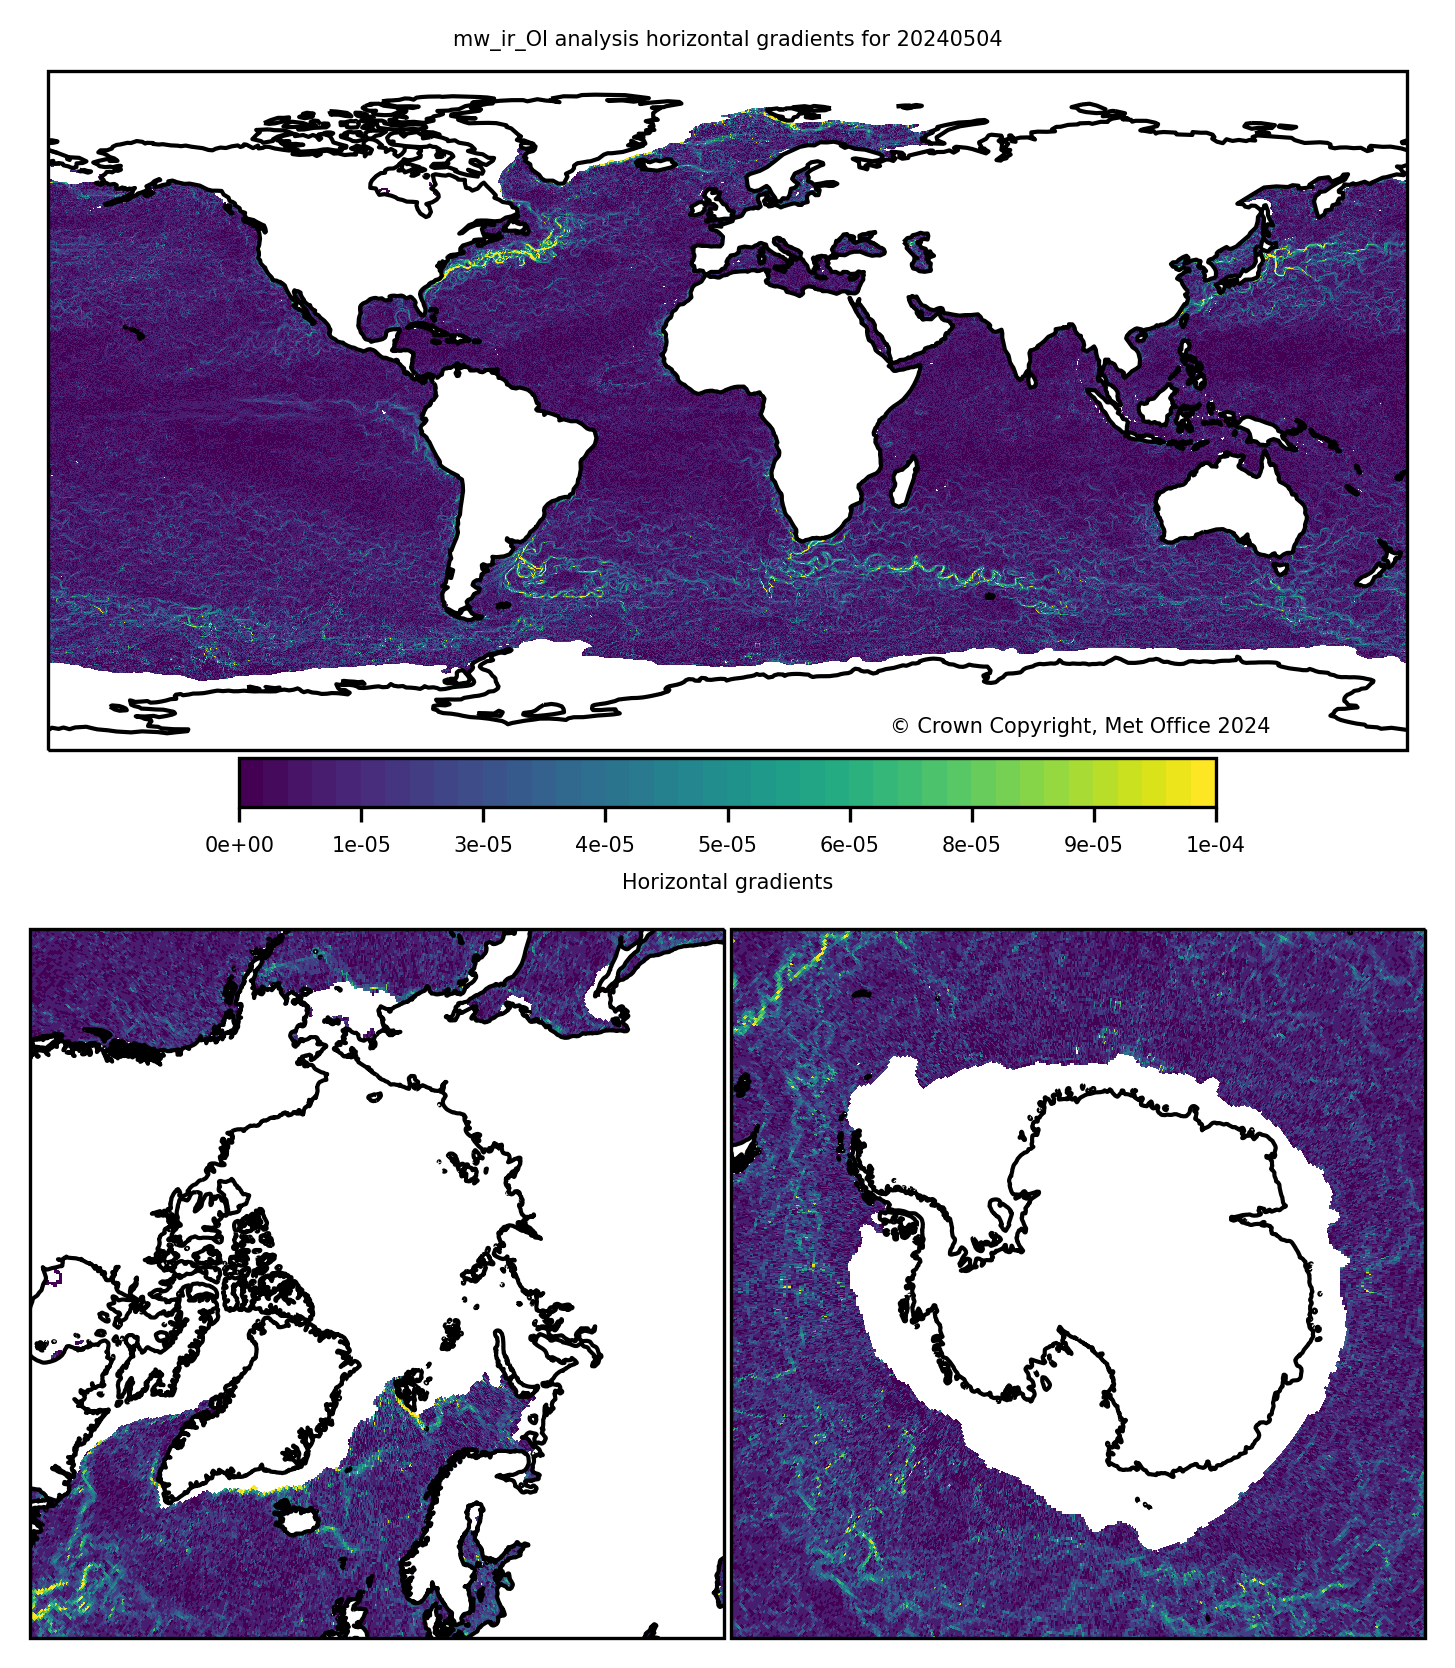
RSS MW IR Fusion SST analysis horizontal gradients. Animation of last 7 days.
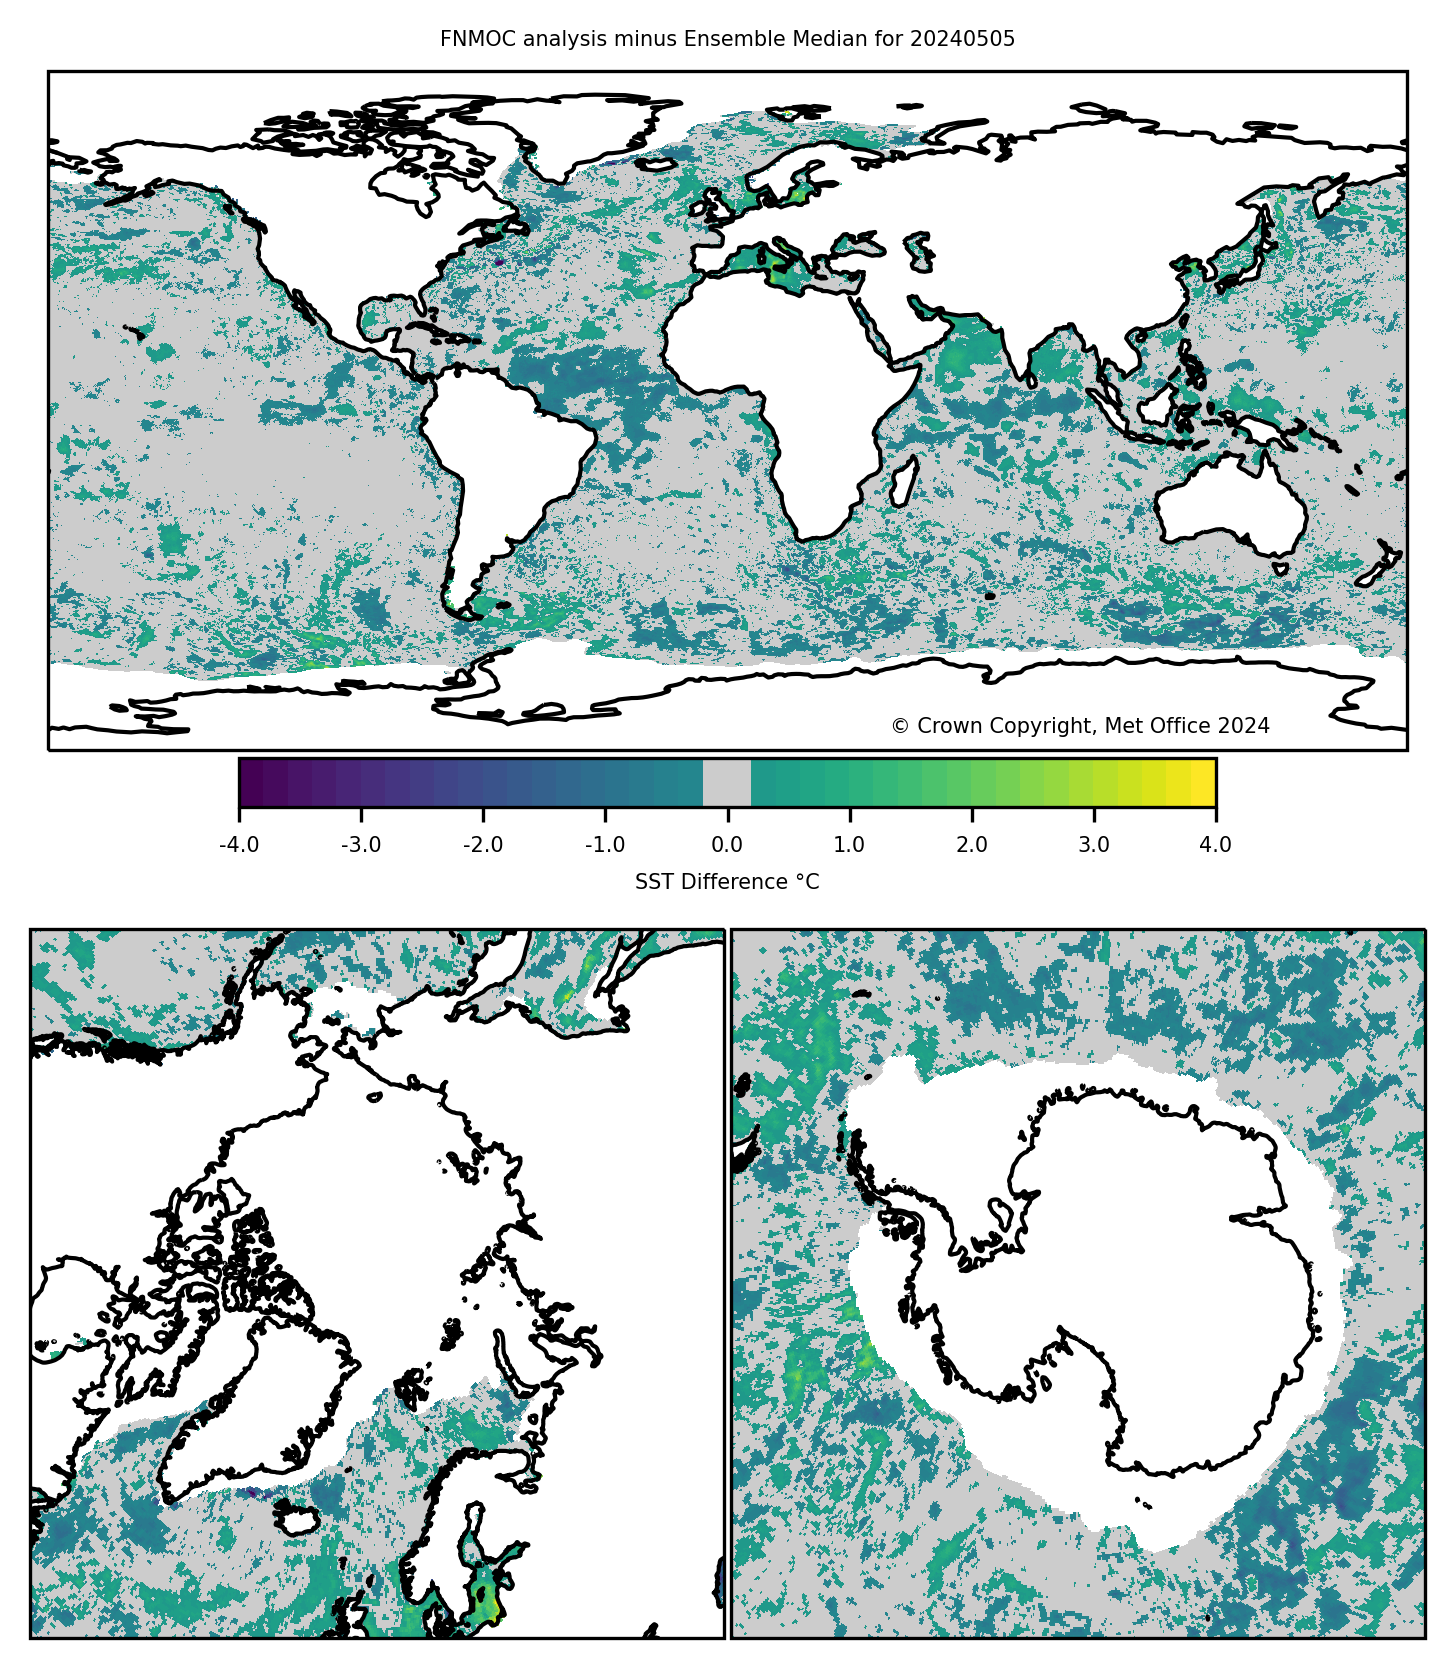
FNMOC minus ensemble median SST analysis. Animation of last 7 days.
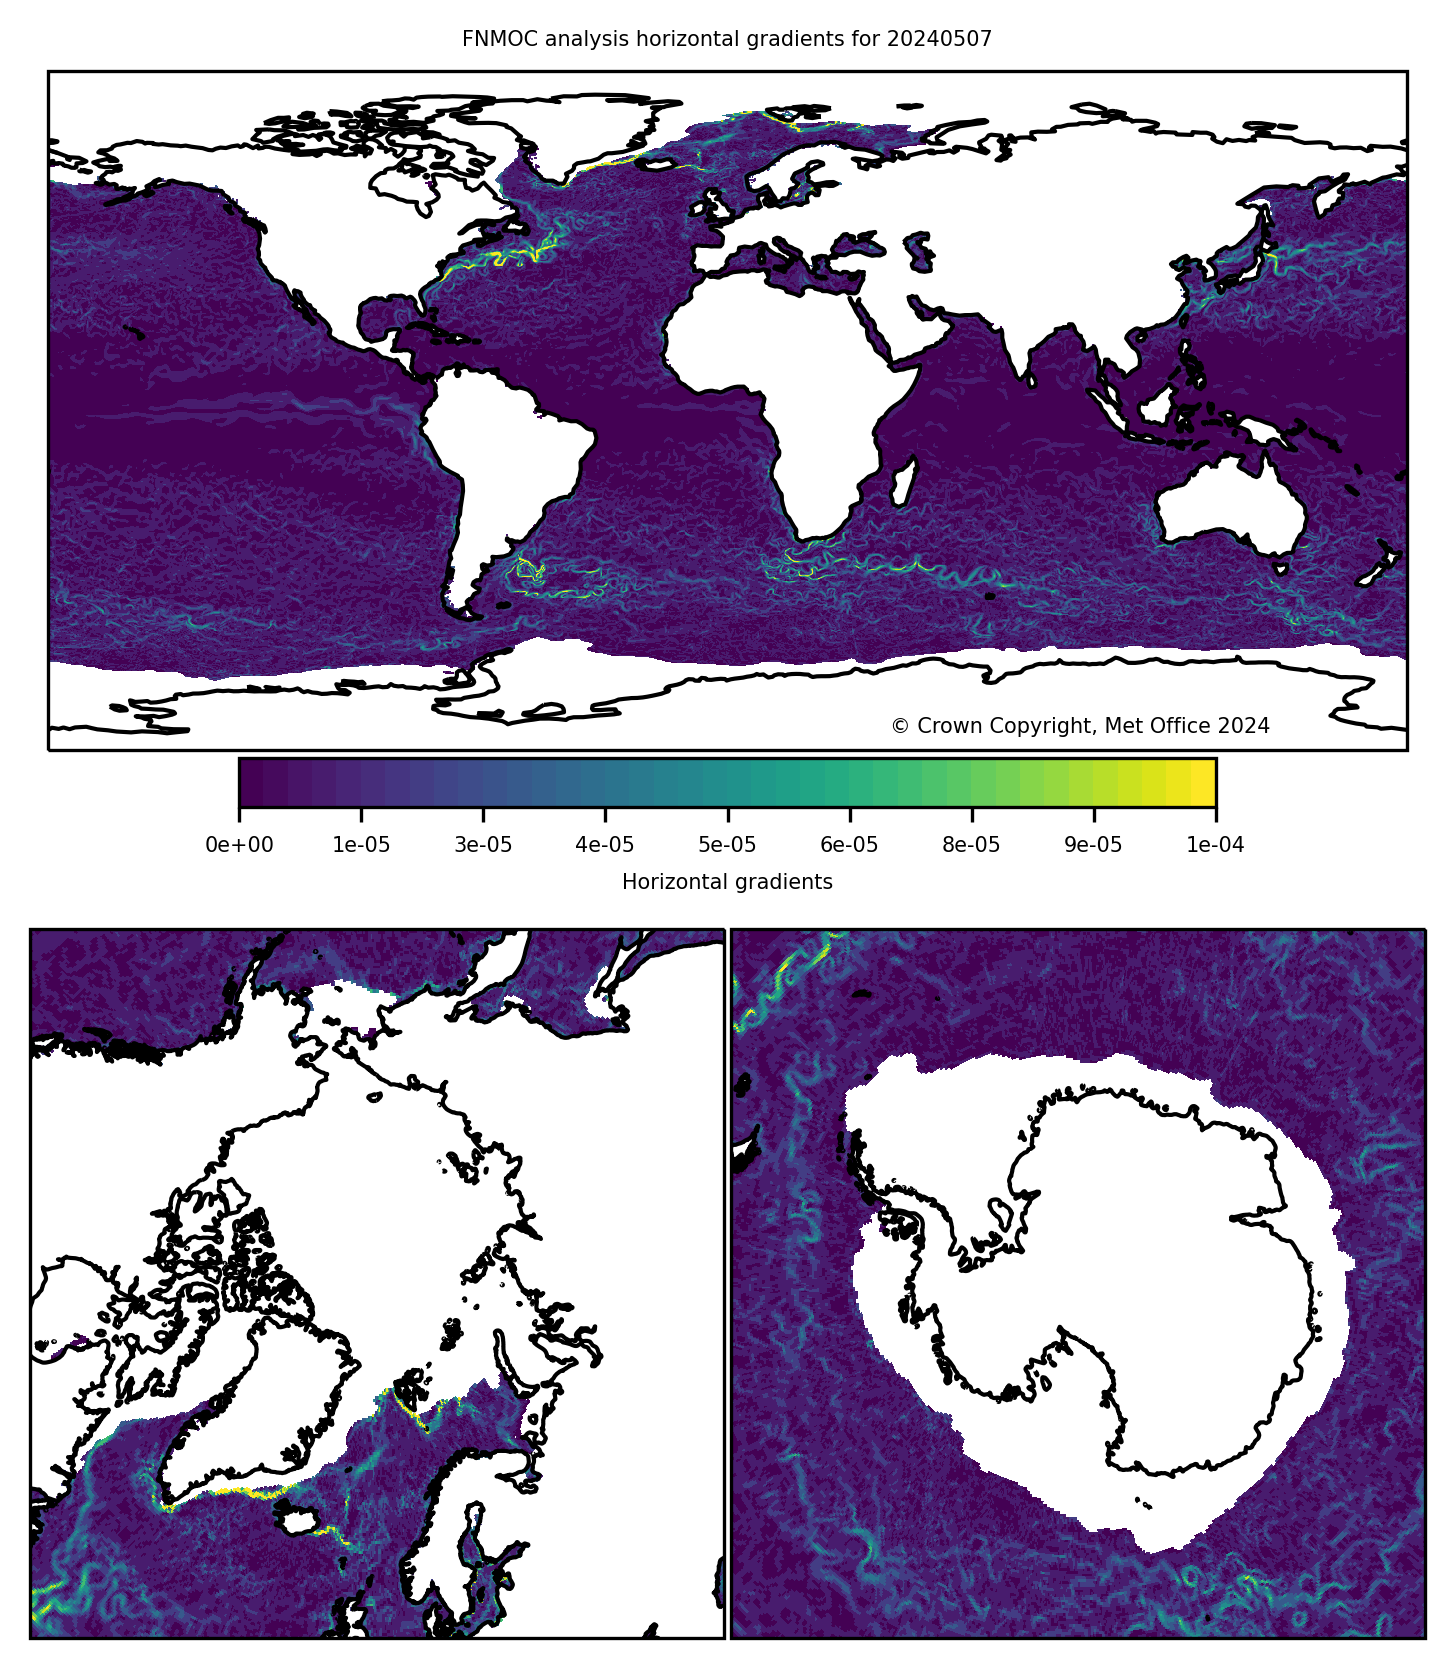
FNMOC SST analysis horizontal gradients. Animation of last 7 days.
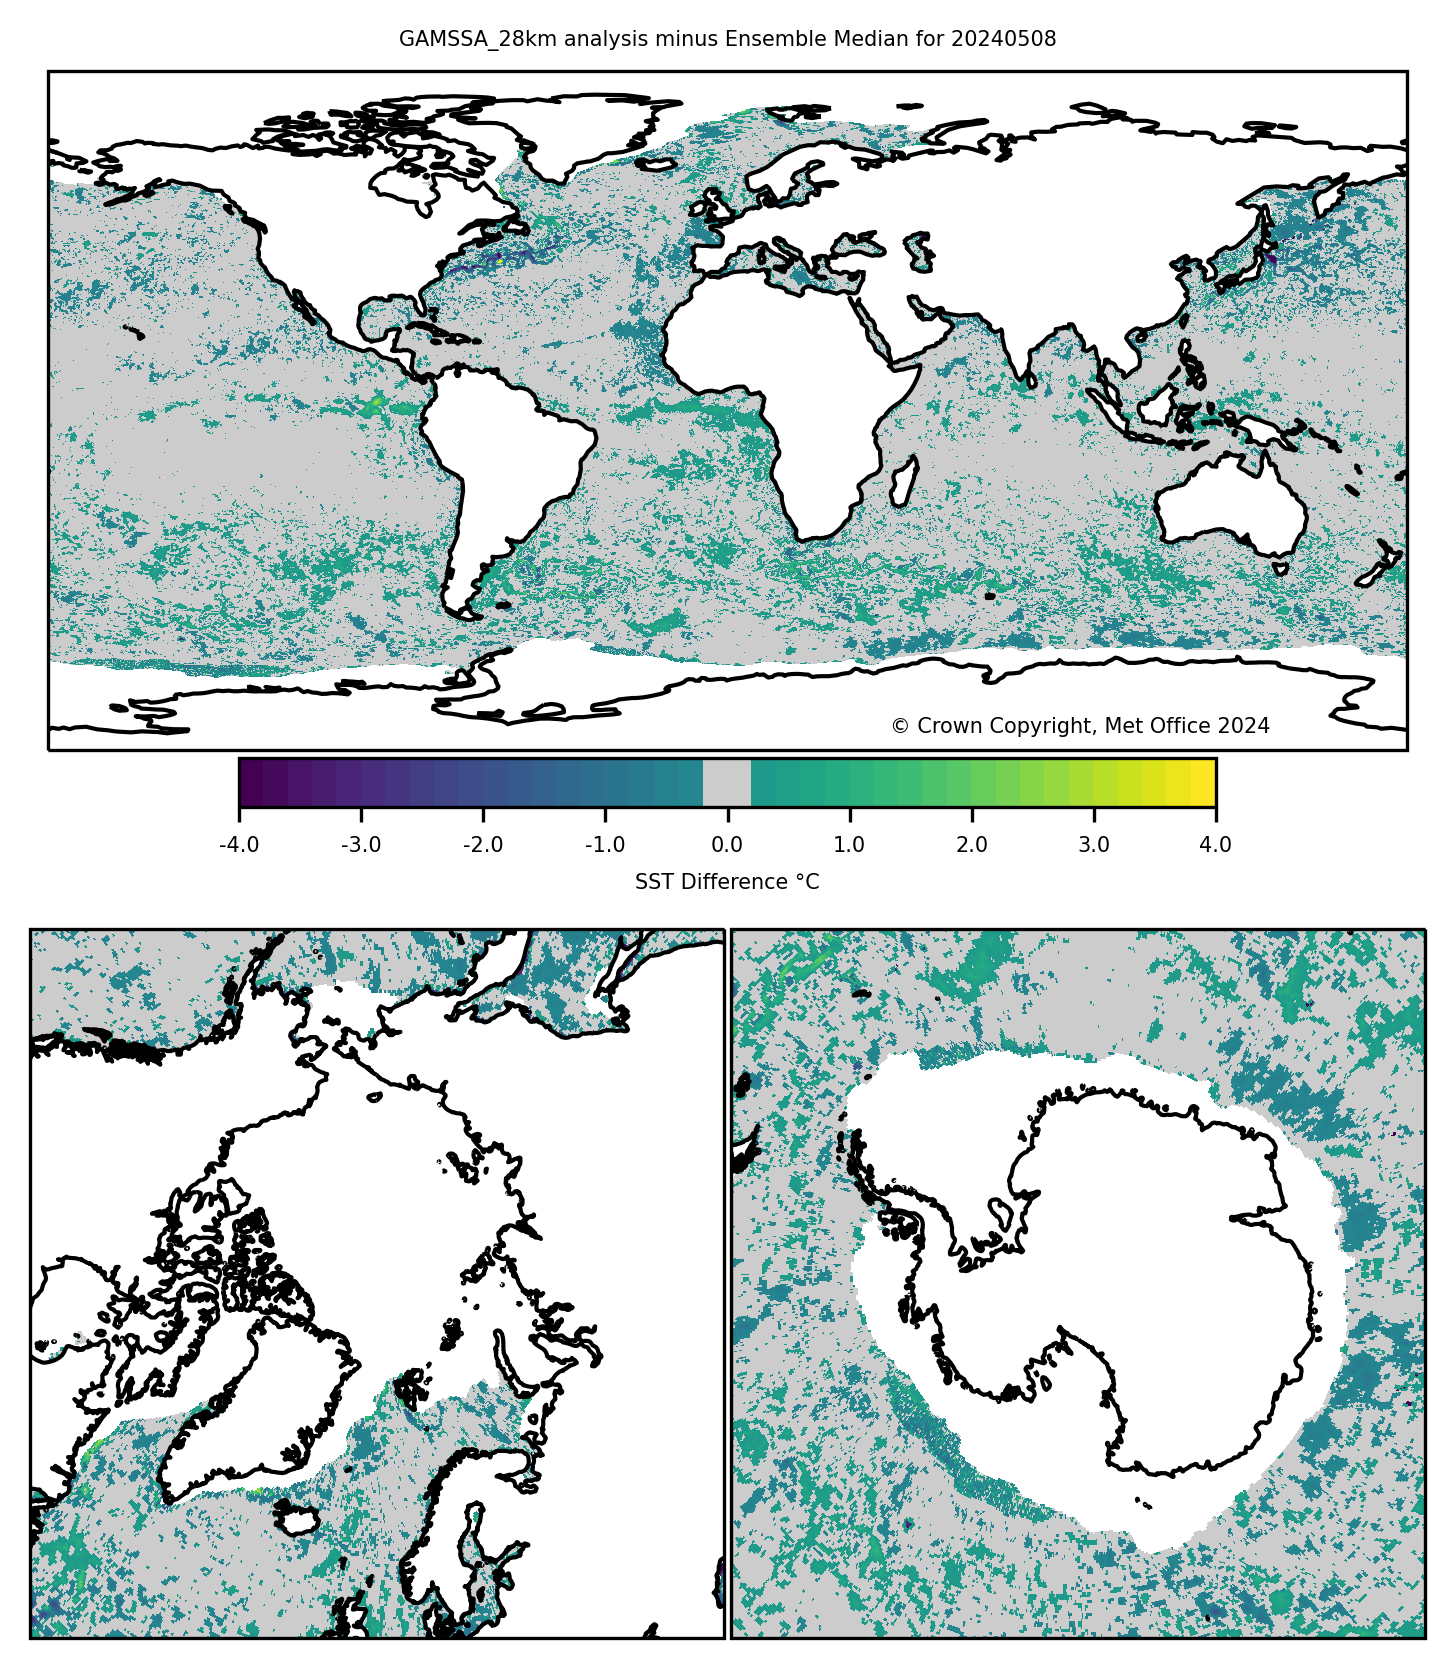
GAMSSA 28km minus ensemble median SST analysis. Animation of last 7 days.
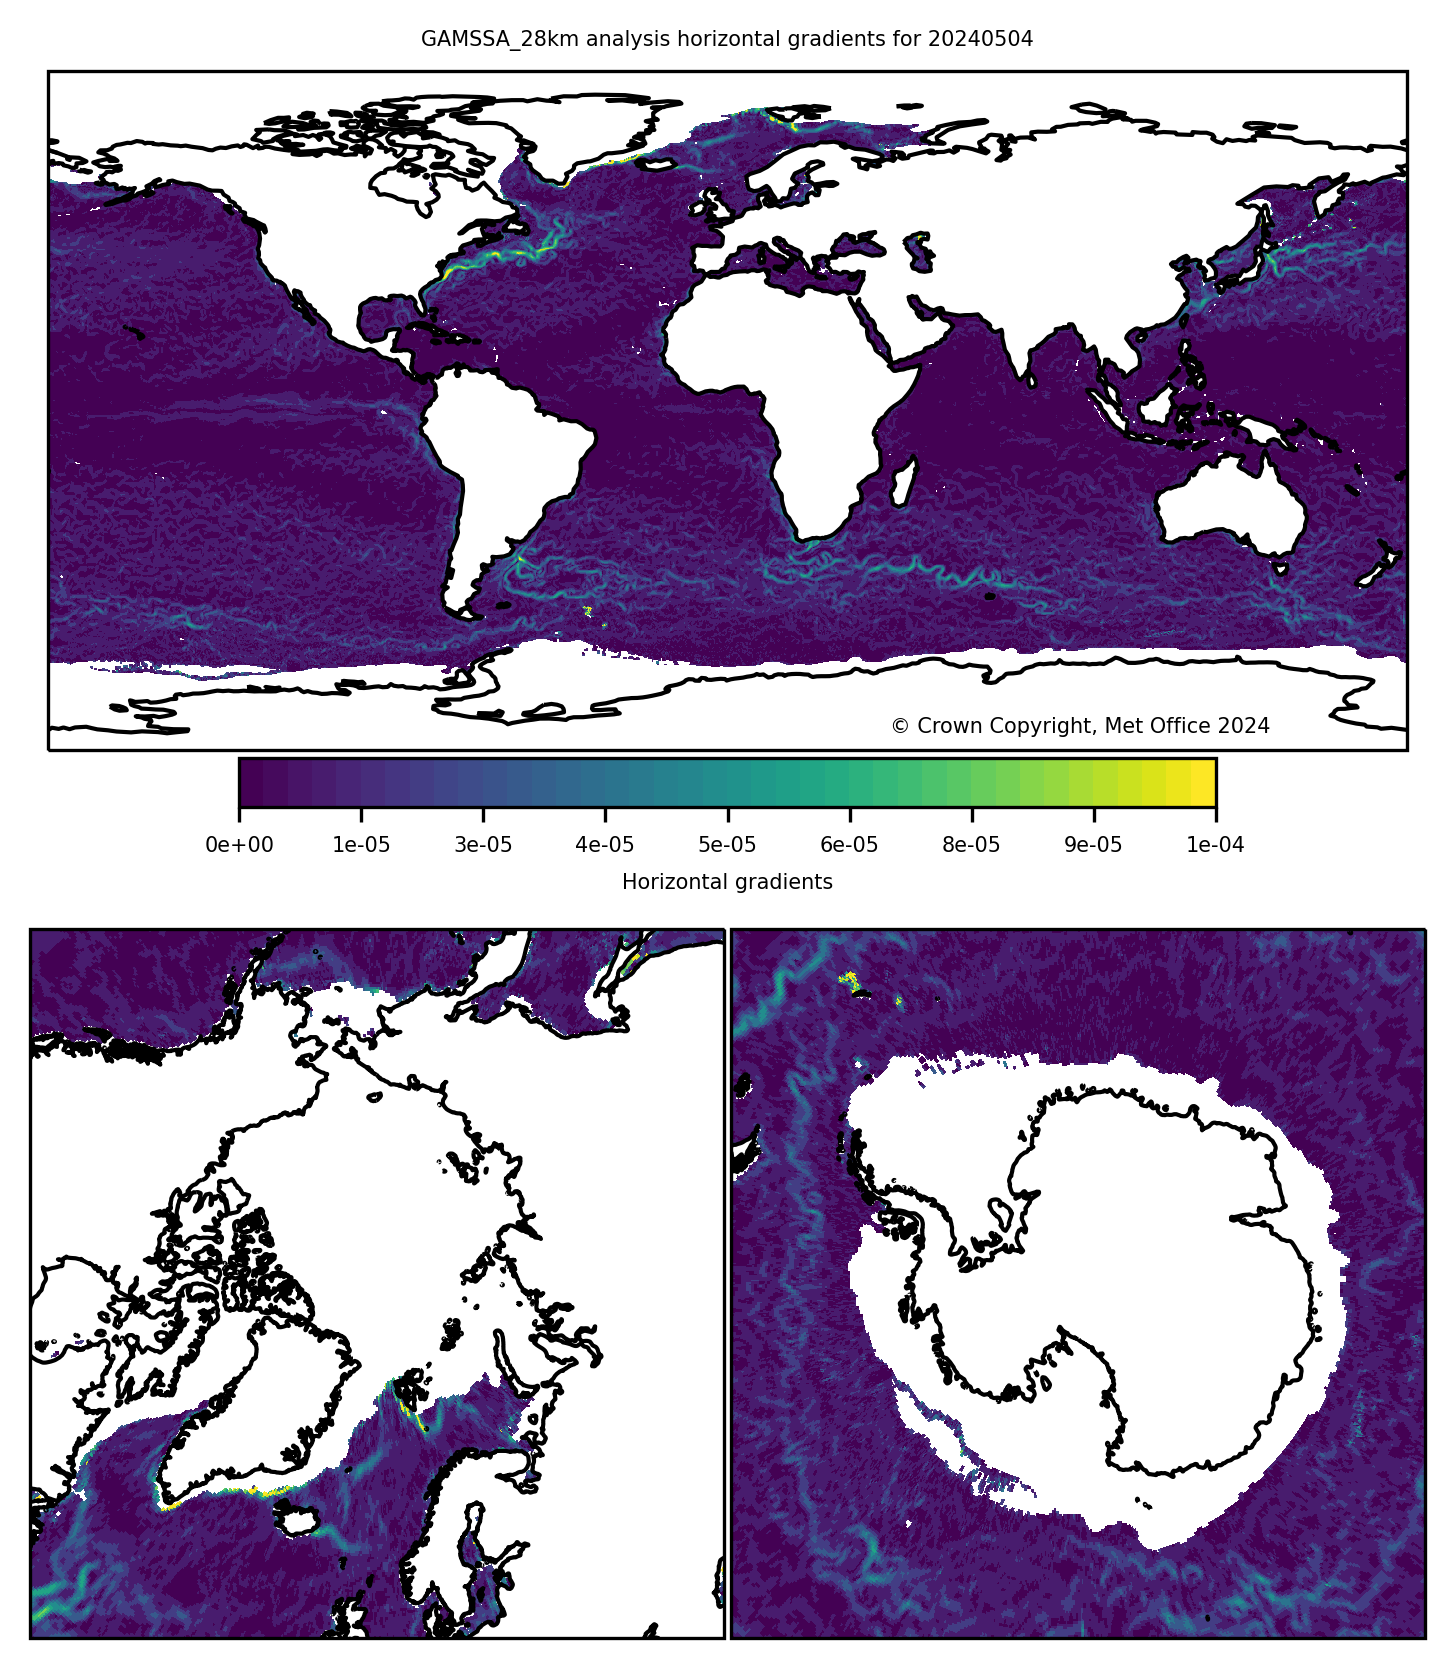
GAMSSA 28km SST analysis horizontal gradients. Animation of last 7 days.
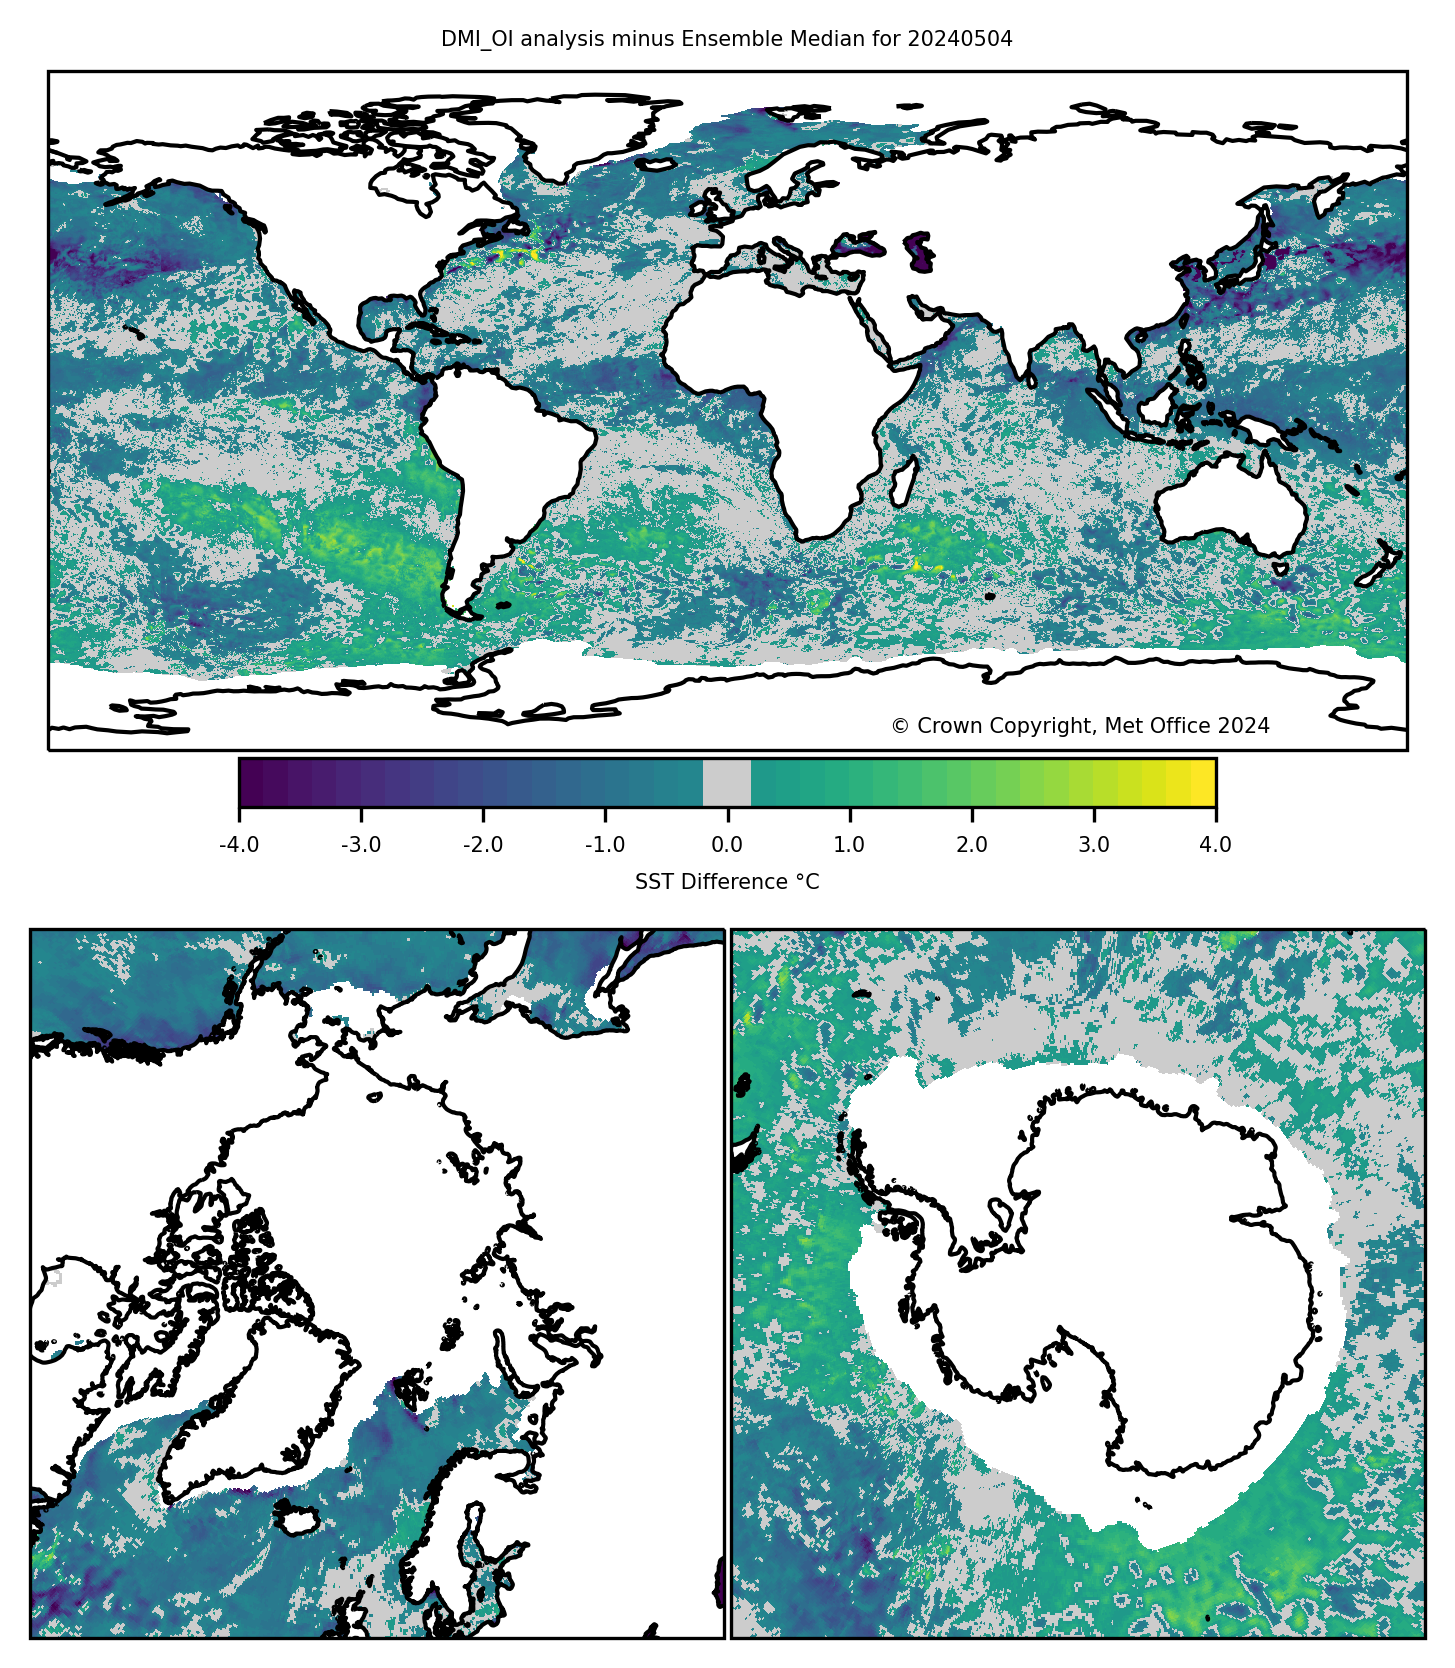
DMI_OI minus ensemble median SST analysis. Animation of last 7 days.
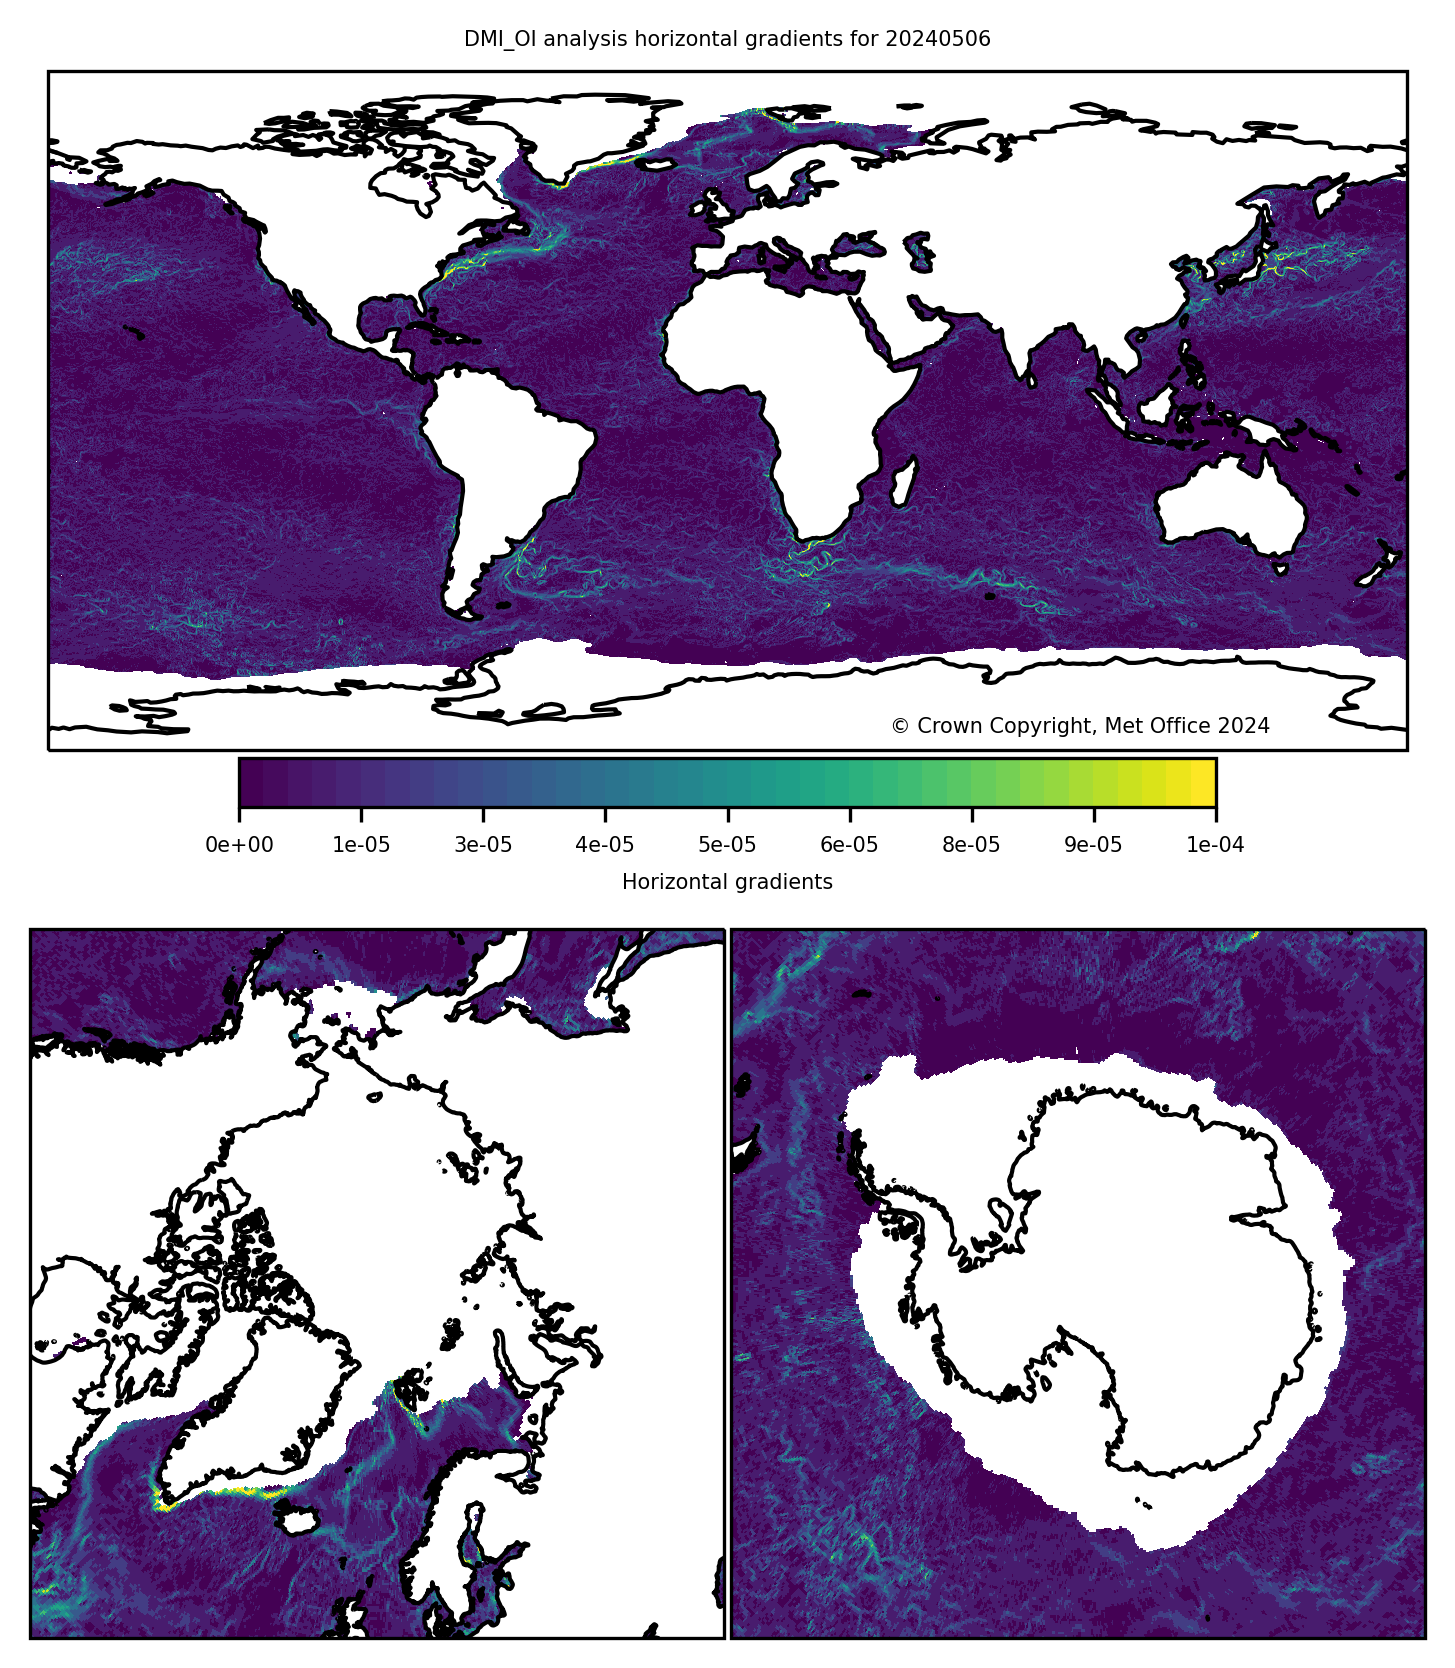
DMI_OI SST analysis horizontal gradients. Animation of last 7 days.
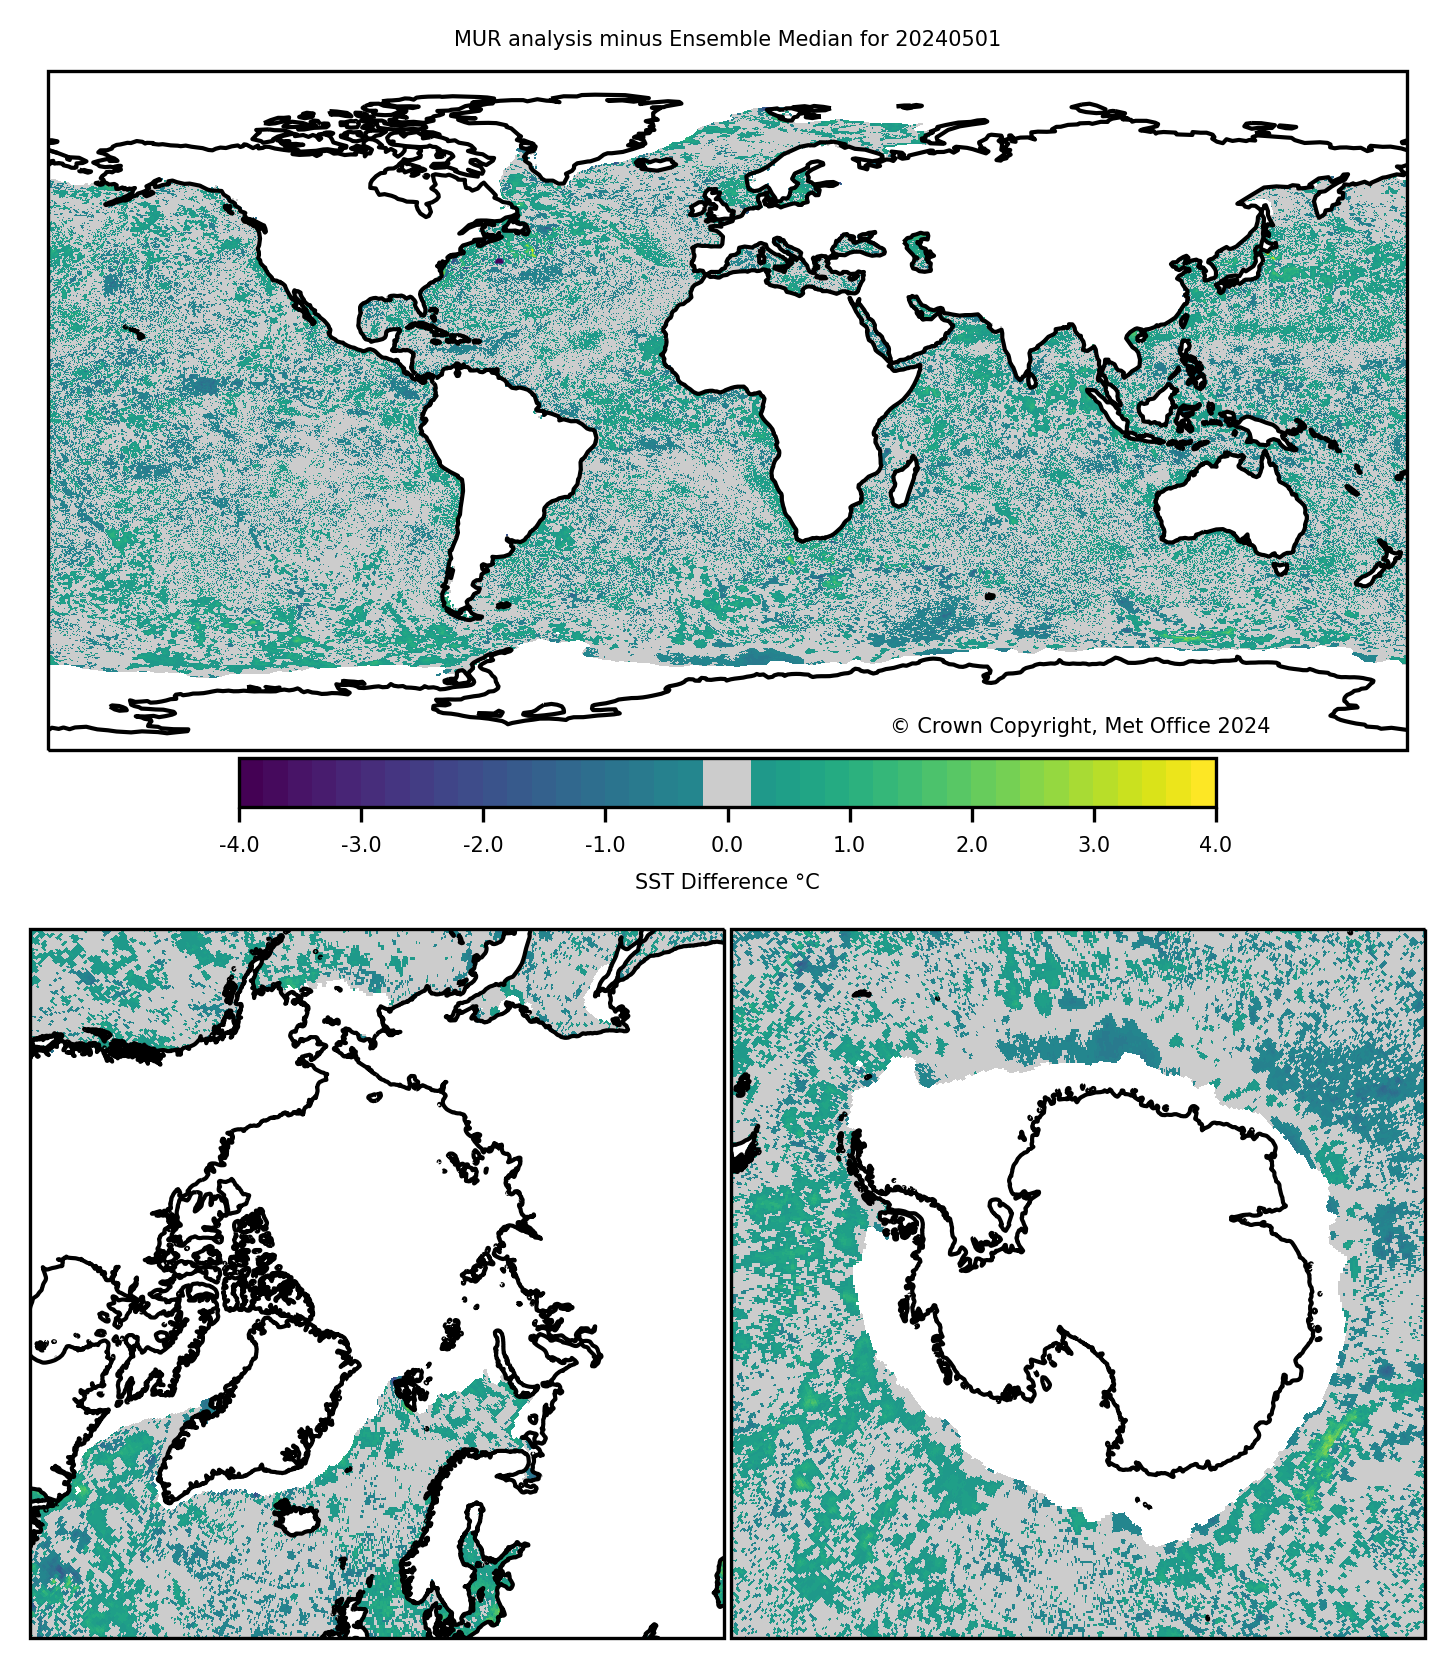
MUR minus ensemble median SST analysis. Animation of last 7 days.
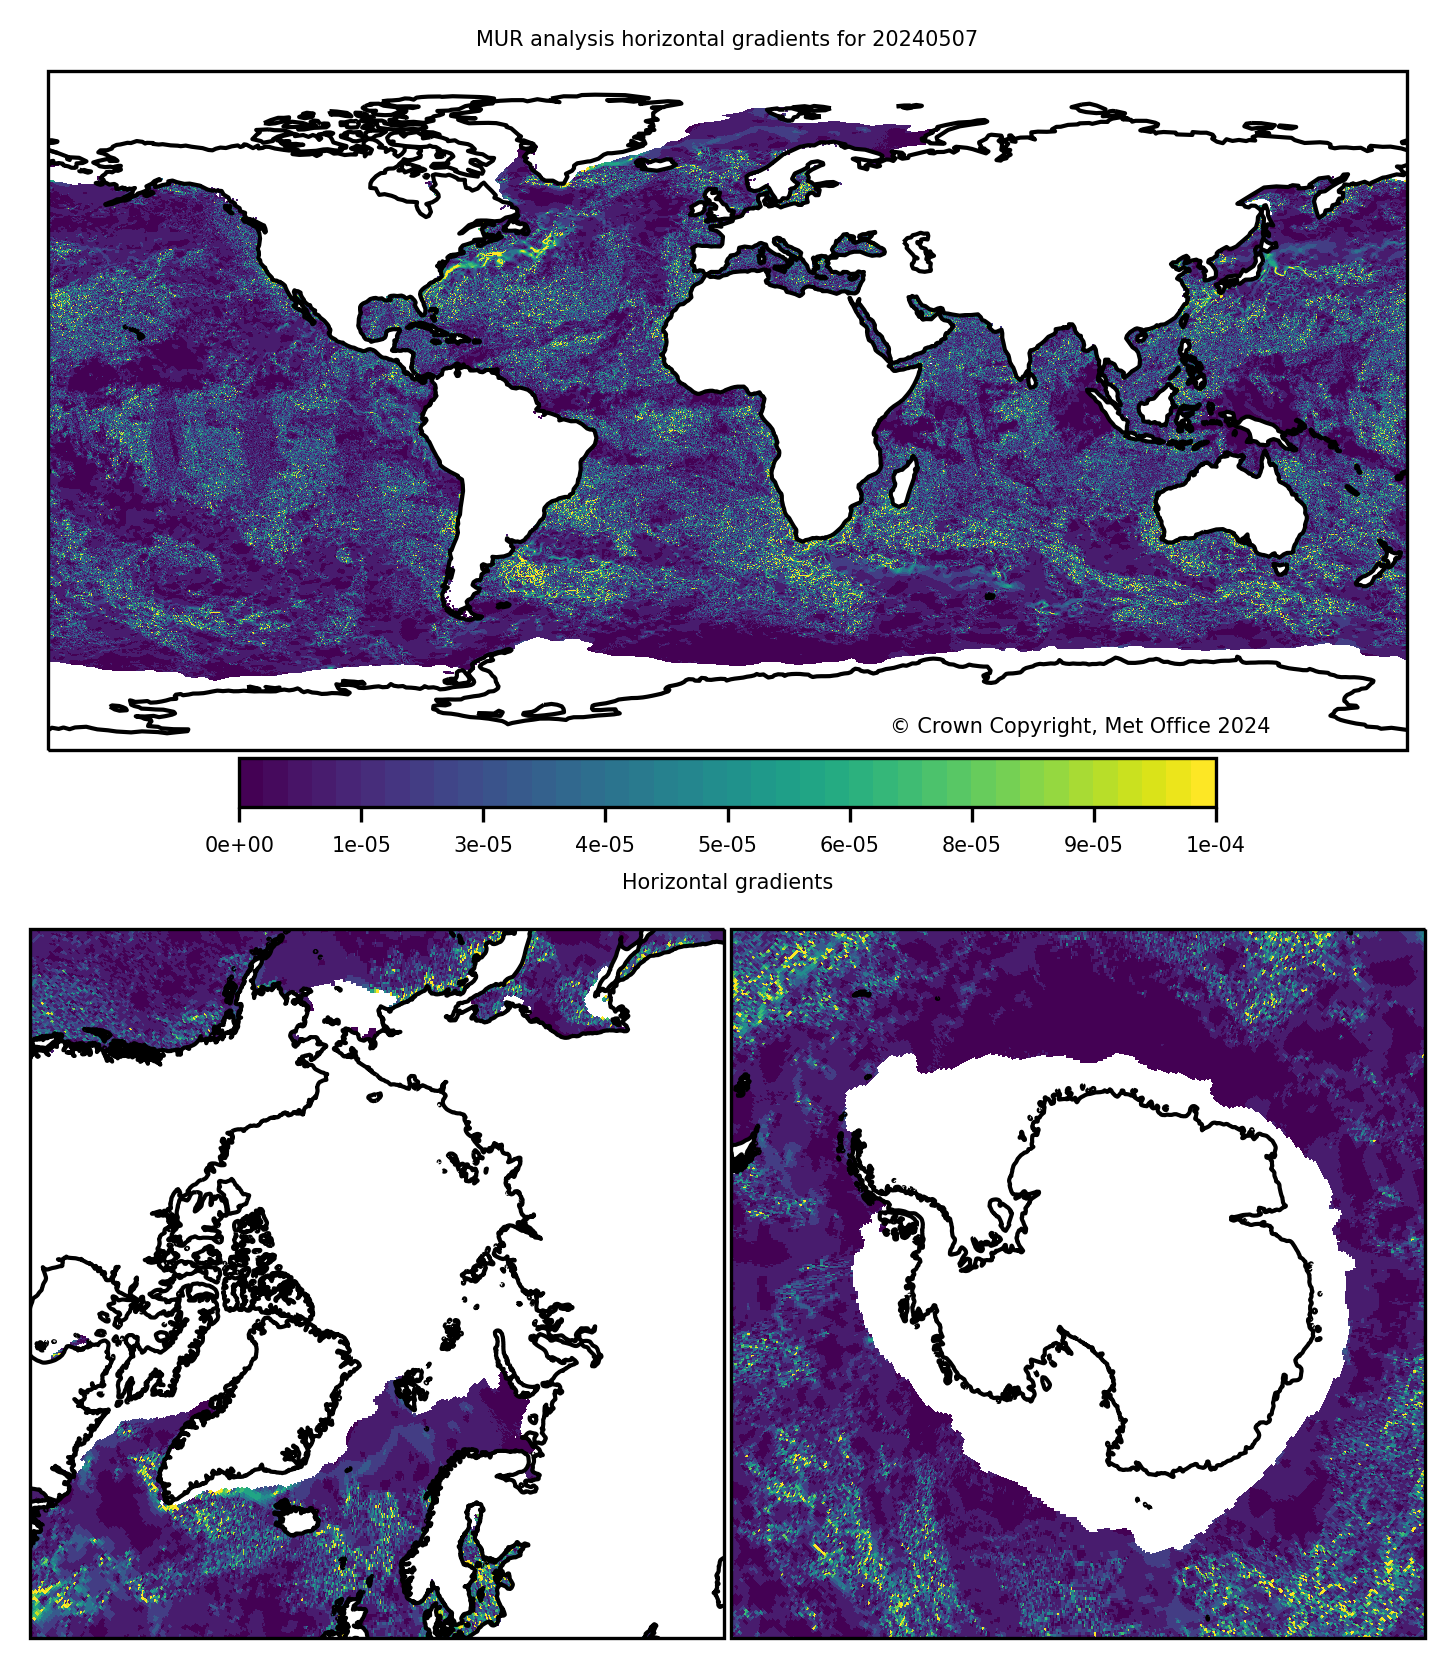
MUR SST analysis horizontal gradients. Animation of last 7 days.
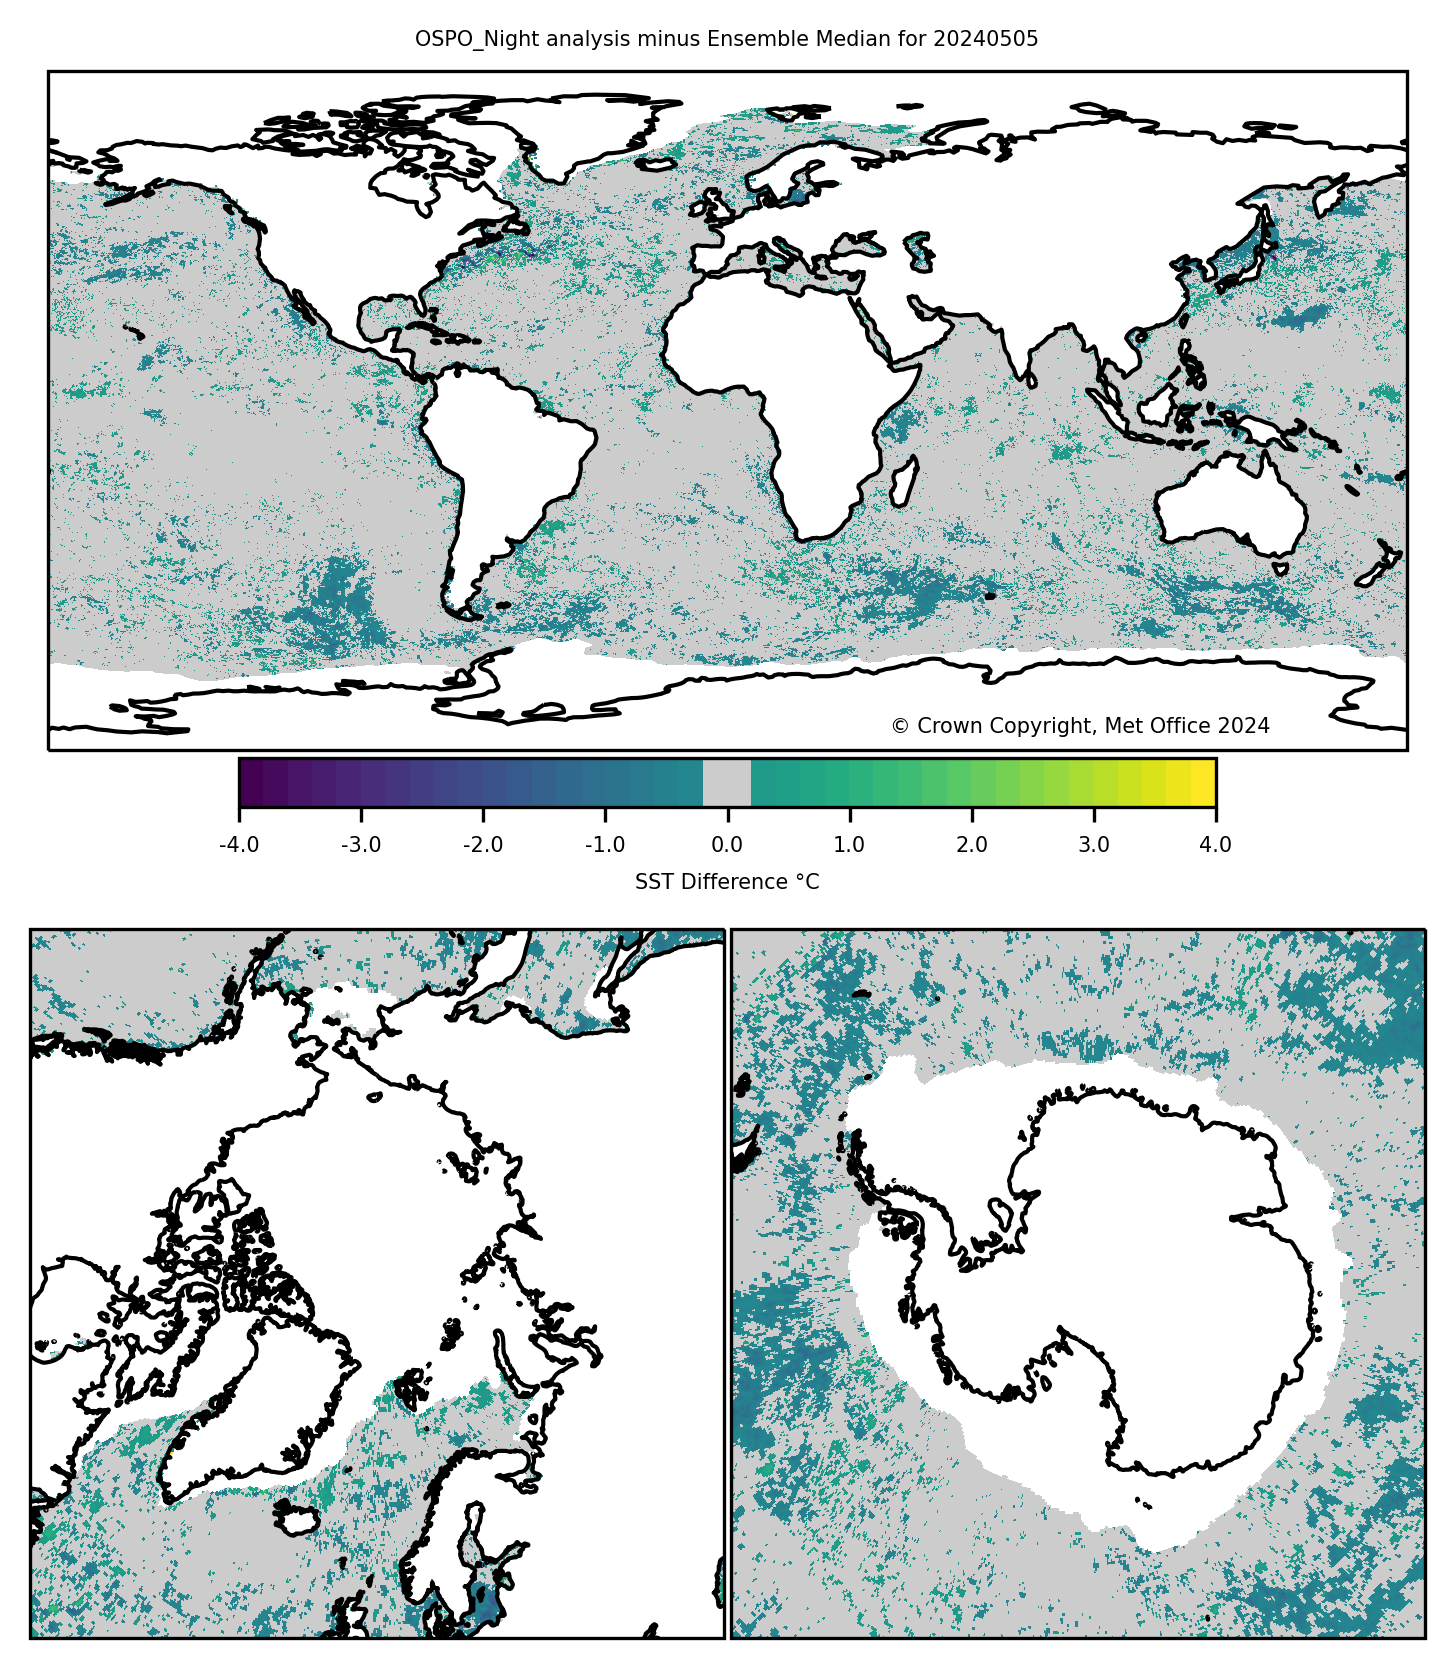
OSPO_Night minus ensemble median SST analysis. Animation of last 7 days.
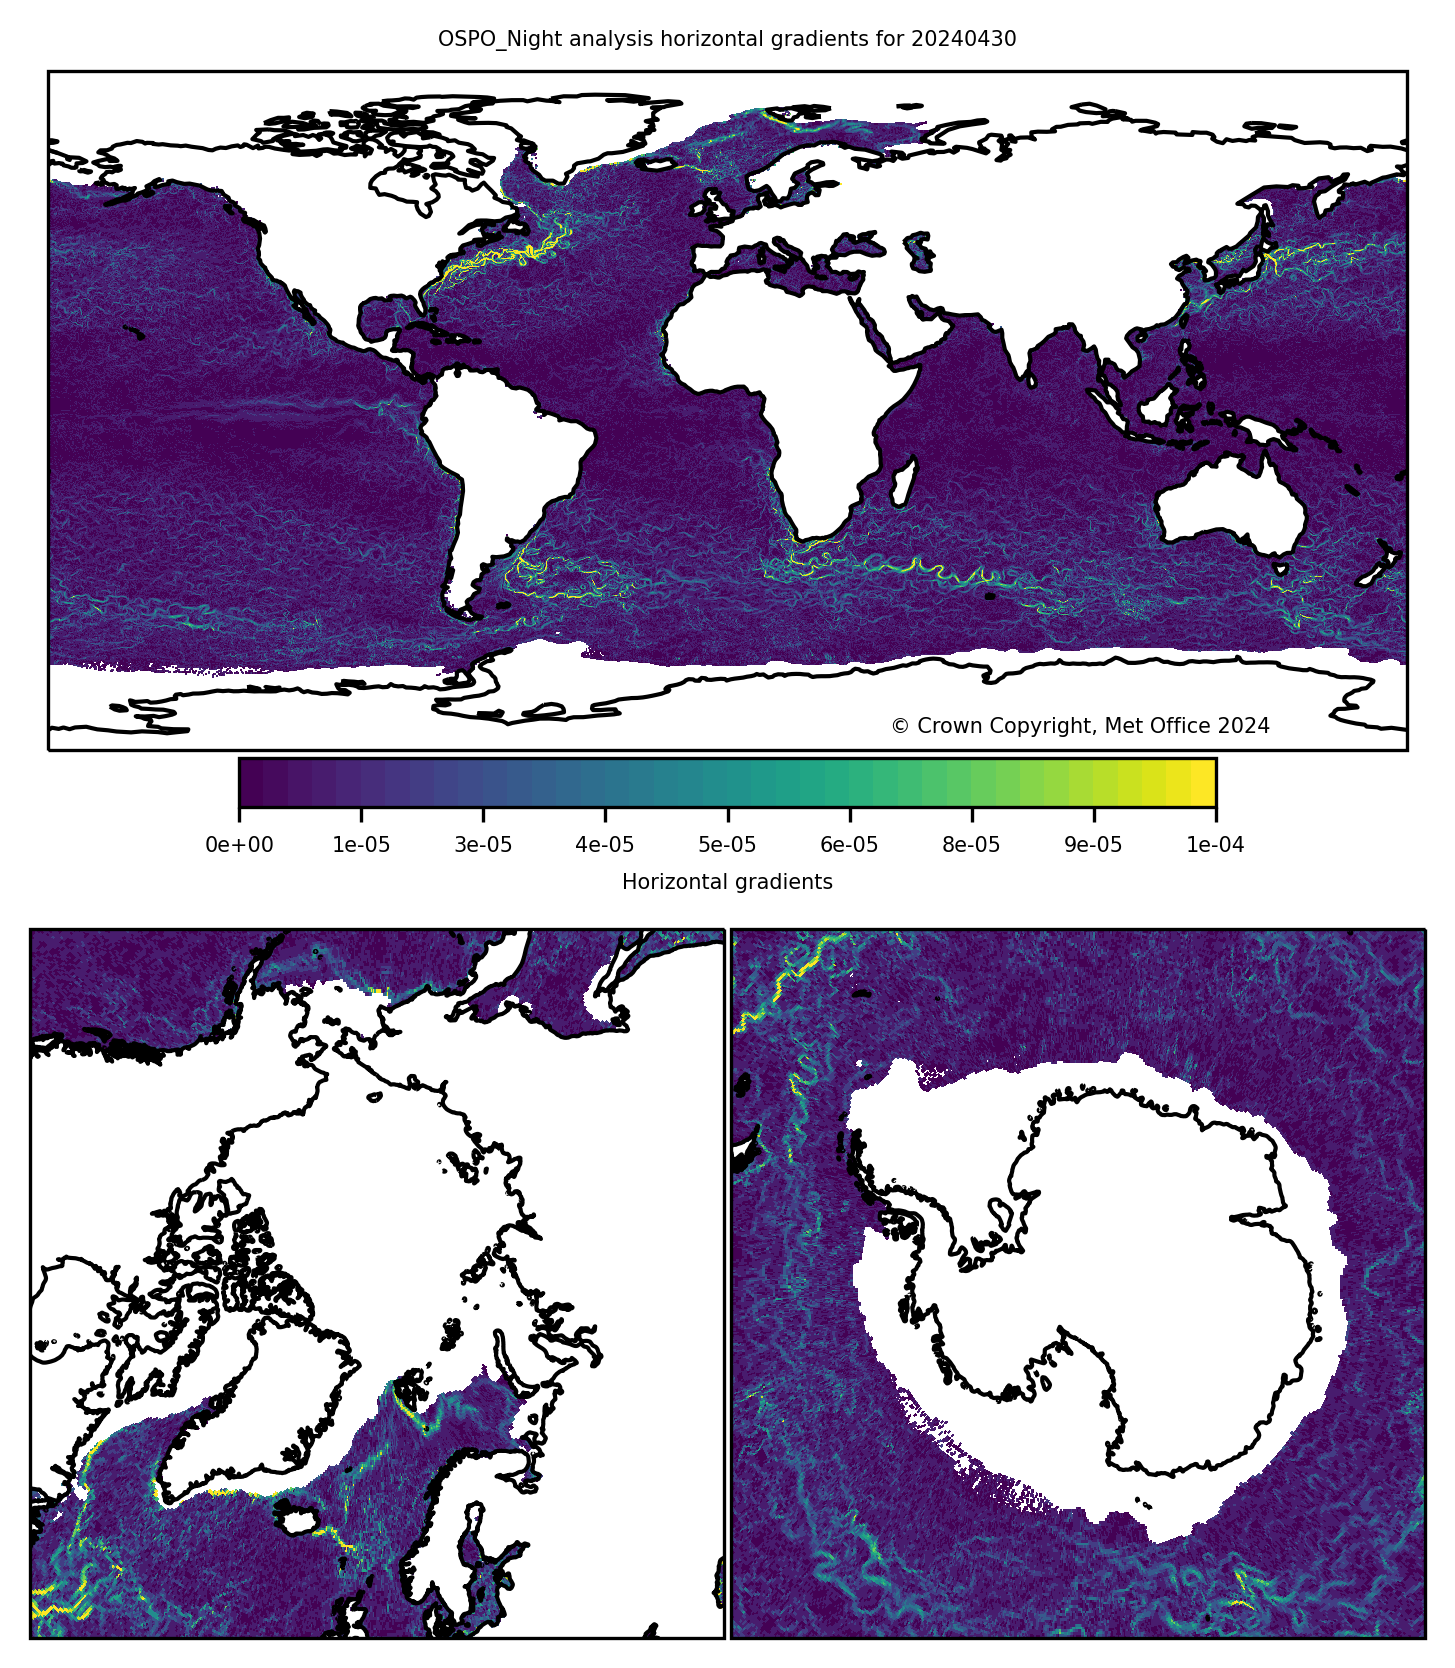
OSPO_Night SST analysis horizontal gradients. Animation of last 7 days.
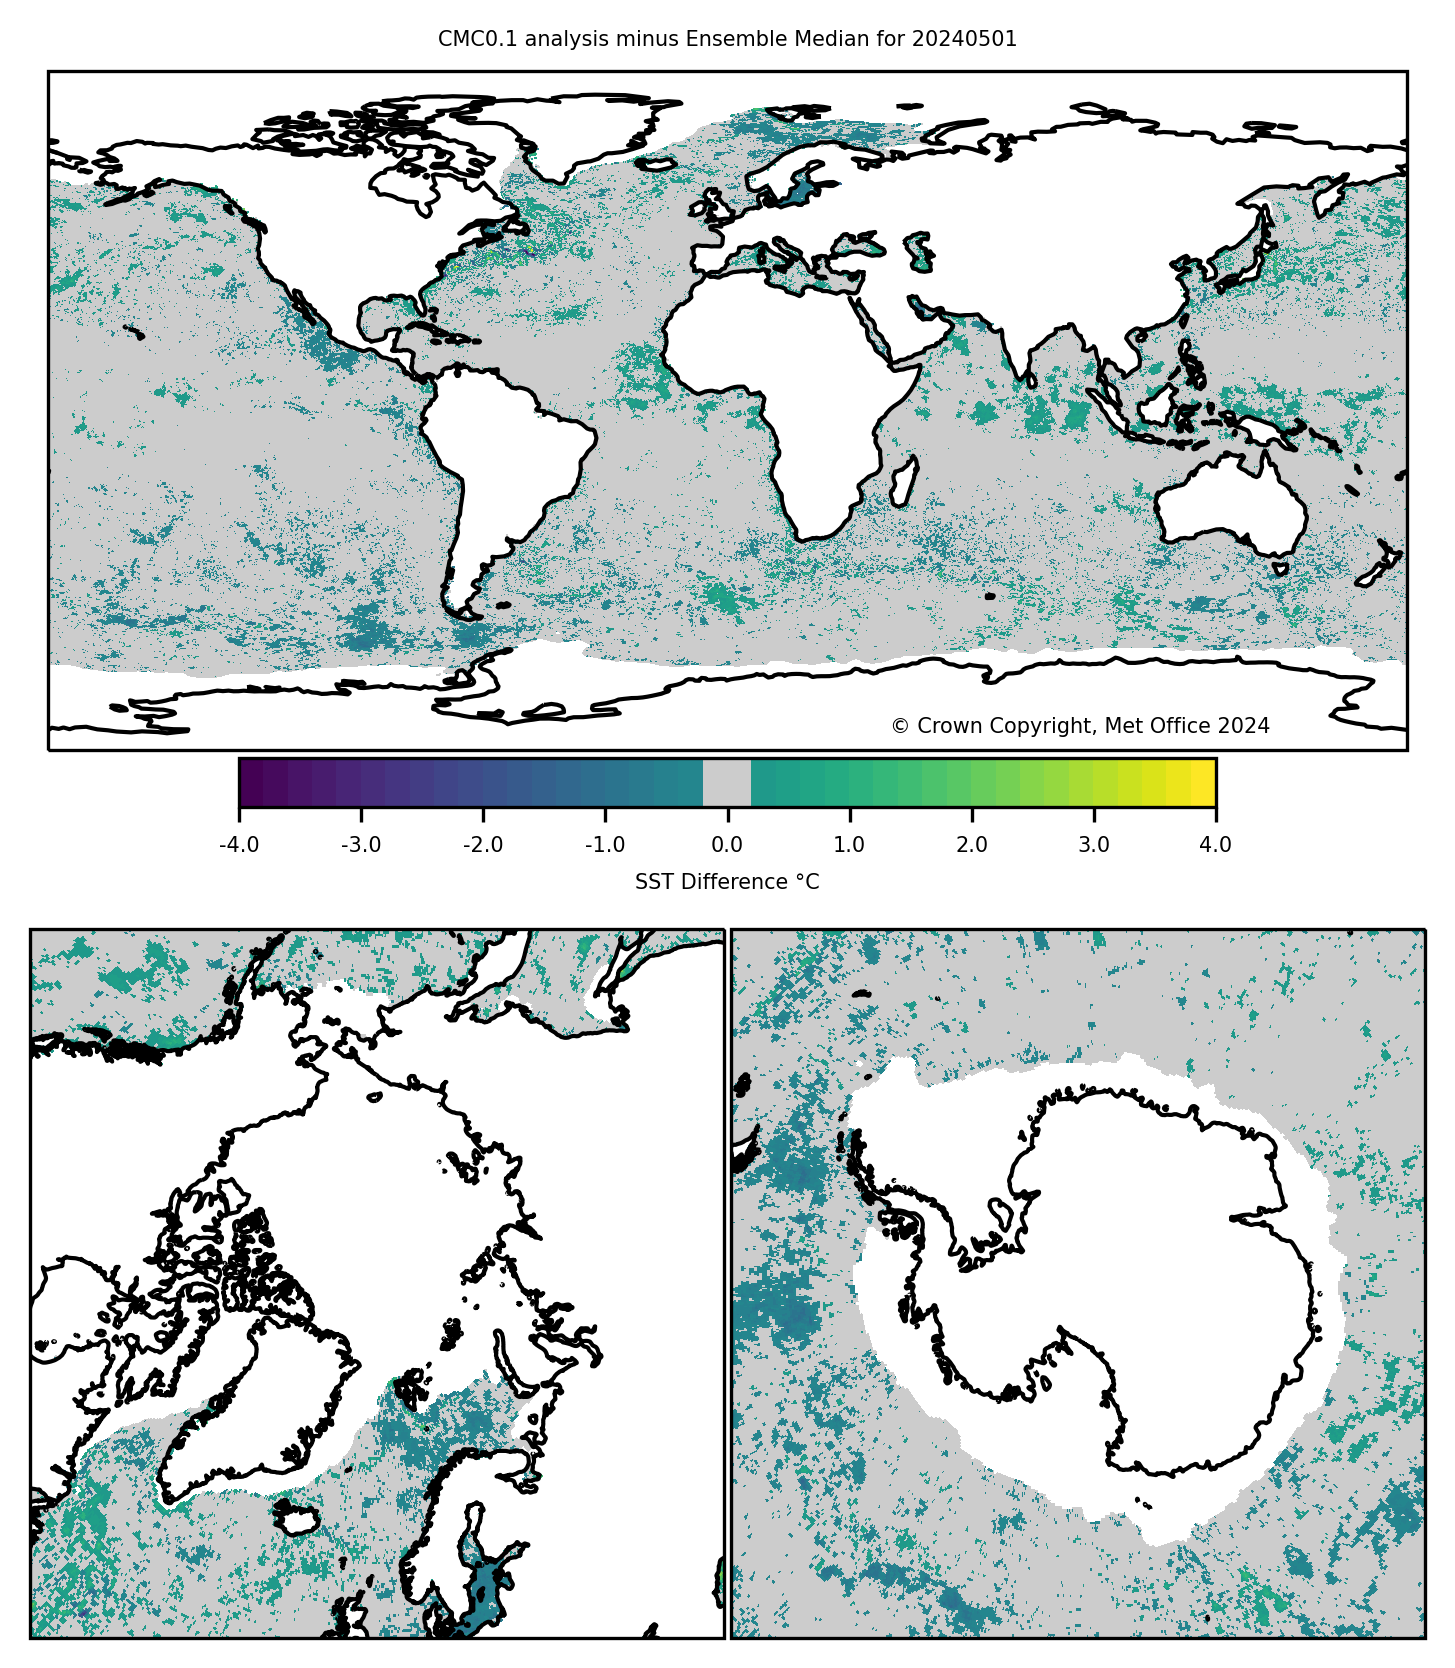
CMC0.1 minus ensemble median SST analysis. Animation of last 7 days.
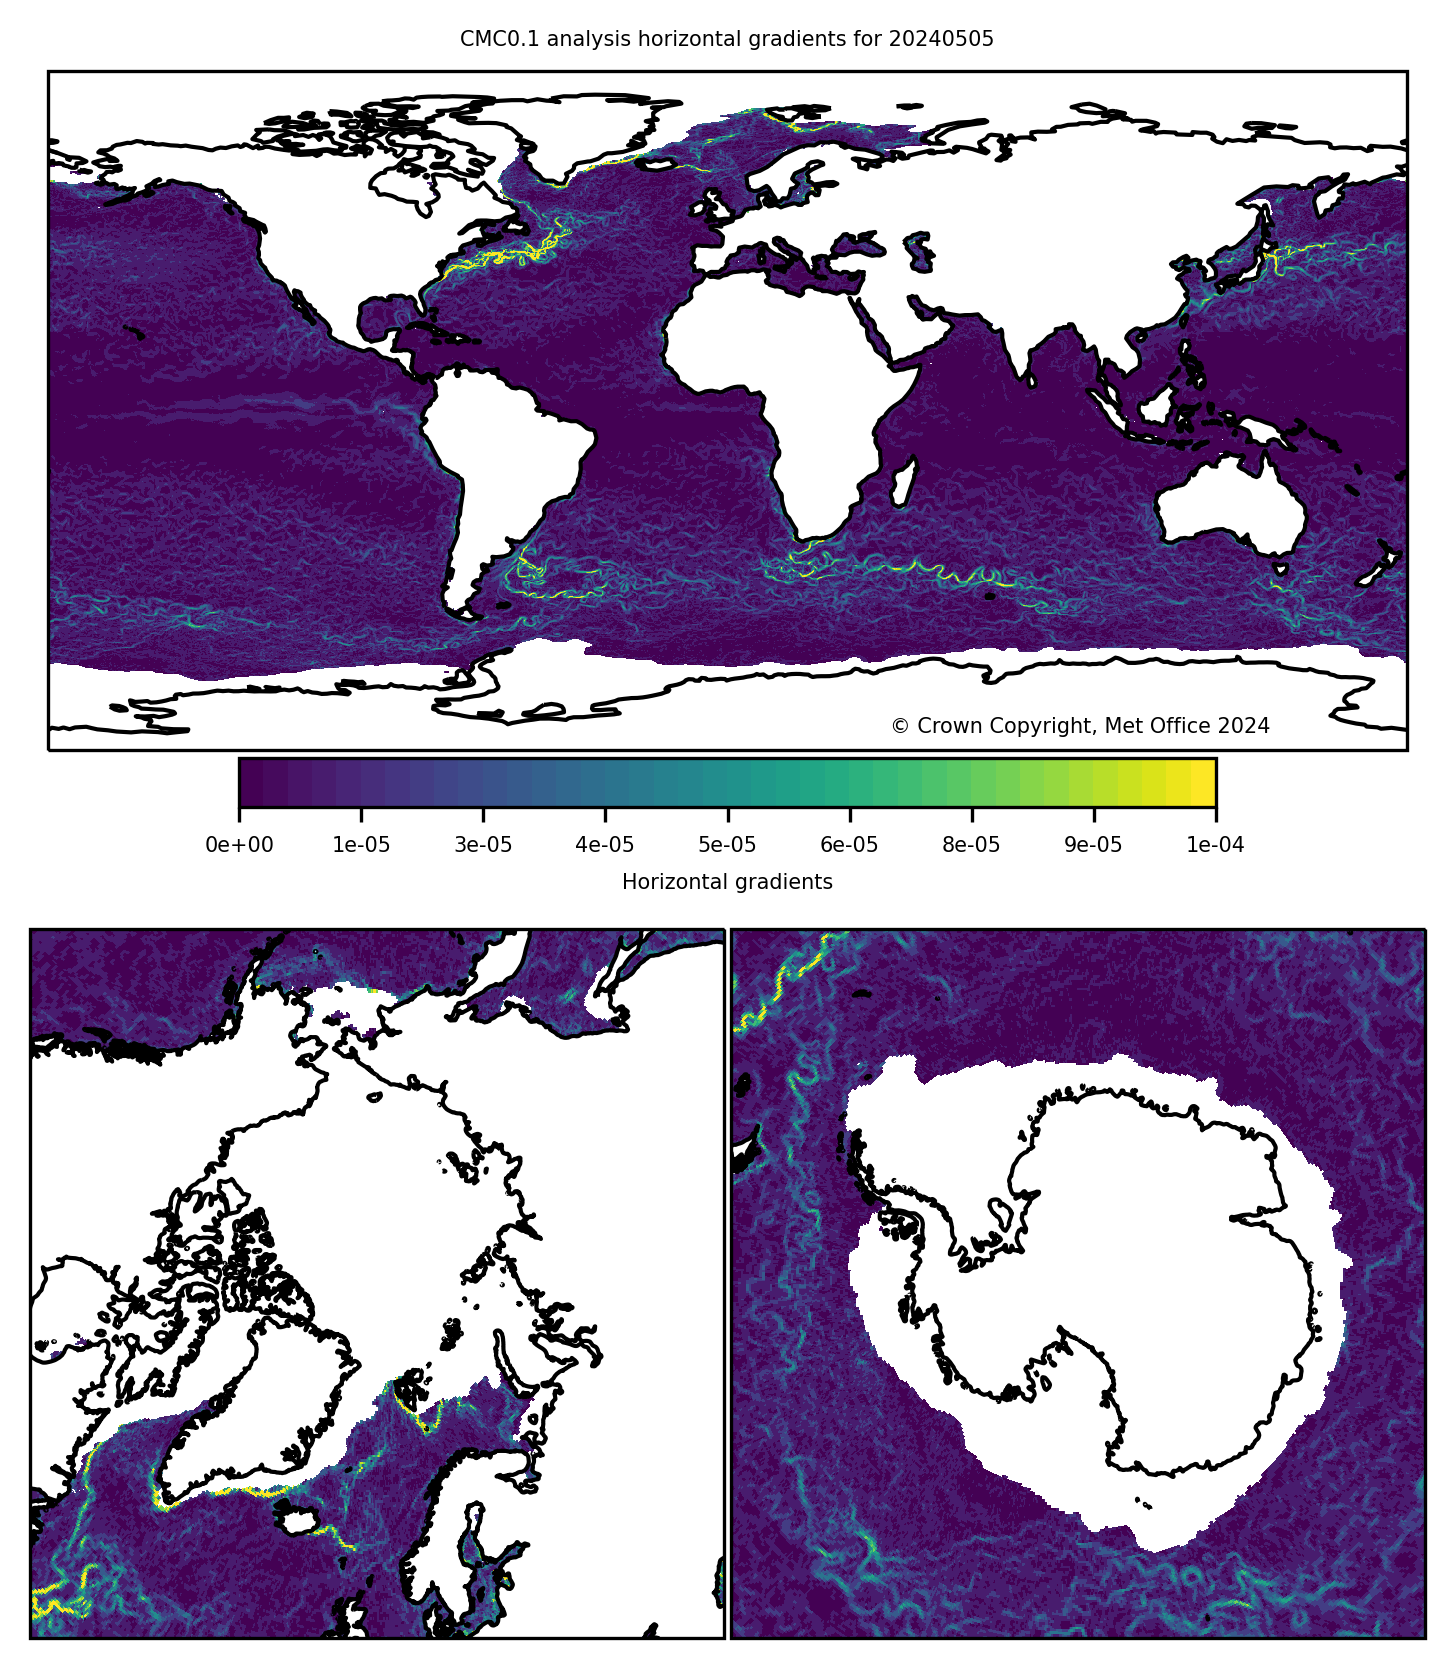
CMC0.1 SST analysis horizontal gradients. Animation of last 7 days.

ODYESSEA minus ensemble median SST analysis. Animation of last 7 days.

ODYSSEA SST analysis horizontal gradients. Animation of last 7 days.
|
